GAW Report No. 205 - IGAC Project
GAW Report No. 205 - IGAC Project
GAW Report No. 205 - IGAC Project
- No tags were found...
Create successful ePaper yourself
Turn your PDF publications into a flip-book with our unique Google optimized e-Paper software.
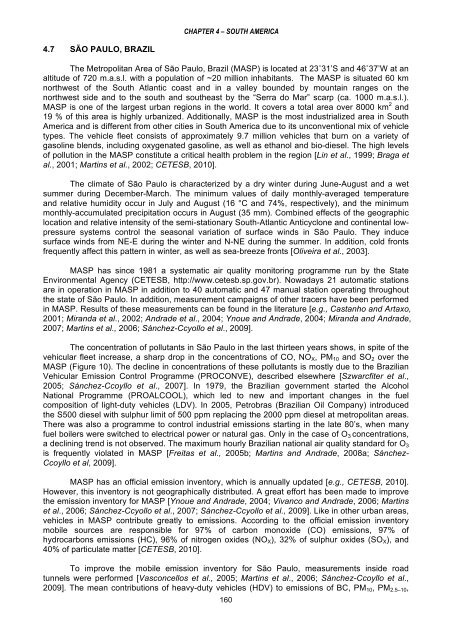
CHAPTER 4 – SOUTH AMERICA4.7 SÃO PAULO, BRAZILThe Metropolitan Area of São Paulo, Brazil (MASP) is located at 23˚31’S and 46˚37’W at analtitude of 720 m.a.s.l. with a population of ~20 million inhabitants. The MASP is situated 60 kmnorthwest of the South Atlantic coast and in a valley bounded by mountain ranges on thenorthwest side and to the south and southeast by the “Serra do Mar” scarp (ca. 1000 m.a.s.l.).MASP is one of the largest urban regions in the world. It covers a total area over 8000 km 2 and19 % of this area is highly urbanized. Additionally, MASP is the most industrialized area in SouthAmerica and is different from other cities in South America due to its unconventional mix of vehicletypes. The vehicle fleet consists of approximately 9.7 million vehicles that burn on a variety ofgasoline blends, including oxygenated gasoline, as well as ethanol and bio-diesel. The high levelsof pollution in the MASP constitute a critical health problem in the region [Lin et al., 1999; Braga etal., 2001; Martins et al., 2002; CETESB, 2010].The climate of São Paulo is characterized by a dry winter during June-August and a wetsummer during December-March. The minimum values of daily monthly-averaged temperatureand relative humidity occur in July and August (16 °C and 74%, respectively), and the minimummonthly-accumulated precipitation occurs in August (35 mm). Combined effects of the geographiclocation and relative intensity of the semi-stationary South-Atlantic Anticyclone and continental lowpressuresystems control the seasonal variation of surface winds in São Paulo. They inducesurface winds from NE-E during the winter and N-NE during the summer. In addition, cold frontsfrequently affect this pattern in winter, as well as sea-breeze fronts [Oliveira et al., 2003].MASP has since 1981 a systematic air quality monitoring programme run by the StateEnvironmental Agency (CETESB, http://www.cetesb.sp.gov.br). <strong>No</strong>wadays 21 automatic stationsare in operation in MASP in addition to 40 automatic and 47 manual station operating throughoutthe state of São Paulo. In addition, measurement campaigns of other tracers have been performedin MASP. Results of these measurements can be found in the literature [e.g., Castanho and Artaxo,2001; Miranda et al., 2002; Andrade et al., 2004; Ynoue and Andrade, 2004; Miranda and Andrade,2007; Martins et al., 2006; Sánchez-Ccyollo et al., 2009].The concentration of pollutants in São Paulo in the last thirteen years shows, in spite of thevehicular fleet increase, a sharp drop in the concentrations of CO, NO X , PM 10 and SO 2 over theMASP (Figure 10). The decline in concentrations of these pollutants is mostly due to the BrazilianVehicular Emission Control Programme (PROCONVE), described elsewhere [Szwarcfiter et al.,2005; Sánchez-Ccoyllo et al., 2007]. In 1979, the Brazilian government started the AlcoholNational Programme (PROALCOOL), which led to new and important changes in the fuelcomposition of light-duty vehicles (LDV). In 2005, Petrobras (Brazilian Oil Company) introducedthe S500 diesel with sulphur limit of 500 ppm replacing the 2000 ppm diesel at metropolitan areas.There was also a programme to control industrial emissions starting in the late 80’s, when manyfuel boilers were switched to electrical power or natural gas. Only in the case of O 3 concentrations,a declining trend is not observed. The maximum hourly Brazilian national air quality standard for O 3is frequently violated in MASP [Freitas et al., 2005b; Martins and Andrade, 2008a; Sánchez-Ccoyllo et al, 2009].MASP has an official emission inventory, which is annually updated [e.g., CETESB, 2010].However, this inventory is not geographically distributed. A great effort has been made to improvethe emission inventory for MASP [Ynoue and Andrade, 2004; Vivanco and Andrade, 2006; Martinset al., 2006; Sánchez-Ccyollo et al., 2007; Sánchez-Ccyollo et al., 2009]. Like in other urban areas,vehicles in MASP contribute greatly to emissions. According to the official emission inventorymobile sources are responsible for 97% of carbon monoxide (CO) emissions, 97% ofhydrocarbons emissions (HC), 96% of nitrogen oxides (NO X ), 32% of sulphur oxides (SO X ), and40% of particulate matter [CETESB, 2010].To improve the mobile emission inventory for São Paulo, measurements inside roadtunnels were performed [Vasconcellos et al., 2005; Martins et al., 2006; Sánchez-Ccoyllo et al.,2009]. The mean contributions of heavy-duty vehicles (HDV) to emissions of BC, PM 10 , PM 2.5–10 ,160


