Financial Statements 2009 - Manutencoop
Financial Statements 2009 - Manutencoop
Financial Statements 2009 - Manutencoop

Create successful ePaper yourself
Turn your PDF publications into a flip-book with our unique Google optimized e-Paper software.
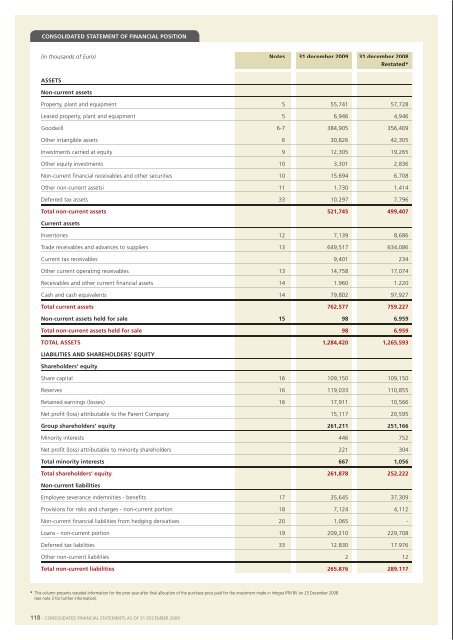
consolIdated statement of fInancIal posItIonconsolIdated statement of fInancIal posItIon(in thousands of Euro) notes 31 december <strong>2009</strong> 31 december 2008restated*assetsnon-current assetsproperty, plant and equipment 5 55,741 57,728leased property, plant and equipment 5 6,946 4,946goodwill 6-7 384,905 356,409other intangible assets 6 30,826 42,305investments carried at equity 9 12,305 19,265other equity investments 10 3,301 2,836non-current financial receivables and other securities 10 15,694 6,708other non-current assetsi 11 1,730 1,414(in thousands of Euro) notes 31 december <strong>2009</strong> 31 december 2008restated*current liabilitiesprovision for risks and charges - current portion 18 7,898 4,315trade payables and advances from customers 21 431,103 490,049Current income taxes 12,022 -other current operating payables 21 133,614 114,014loans and other current financial liabilities 19 172,026 110,531total current liabilities 756,663 718,909liabilities associated with assets held for sale 15 3 5,345total liabilities associated with assets held for sale 3 5,345total lIabIlItIes and shareholders’ eQuItY 1,284,420 1,265,593deferred tax assets 33 10,297 7,796total non-current assets 521,745 499,407current assetsinventories 12 7,139 8,686trade receivables and advances to suppliers 13 649,517 634,086Current tax receivables 9,401 234other current operating receivables 13 14,758 17,074receivables and other current financial assets 14 1,960 1,220Cash and cash equivalents 14 79,802 97,927total current assets 762,577 759,227non-current assets held for sale 15 98 6,959total non-current assets held for sale 98 6,959total assets 1,284,420 1,265,593lIabIlItIes and shareholders’ eQuItYshareholders’ equityshare capital 16 109,150 109,150reserves 16 119,033 110,855retained earnings (losses) 16 17,911 10,566net profit (loss) attributable to the parent Company 15,117 20,595Group shareholders’ equity 261,211 251,166minority interests 446 752net profit (loss) attributable to minority shareholders 221 304total minority interests 667 1,056total shareholders’ equity 261,878 252,222non-current liabilitiesemployee severance indemnities - benefits 17 35,645 37,309provisions for risks and charges - non-current portion 18 7,124 4,112non-current financial liabilities from hedging derivatives 20 1,065 -loans - non-current portion 19 209,210 229,708deferred tax liabilities 33 12,830 17,976other non-current liabilities 2 12total non-current liabilities 265,876 289,117consolIdated Income statement(in thousands of Euro) notes 31 december <strong>2009</strong> 31 december 2008reVenuesrevenues from sales and services 23 1,146,579 688,824other operating revenues 24 4,398 1,772total reVenues 1,150,977 690,596operatInG costsraw materials and consumables 25 (114,012) (98,479)Change in inventories of semi-finished and finished products 105 -services, leases and rentals 26 (580,475) (286,956)payroll costs 27 (337,219) (219,493)other operating costs 28 (6,200) (5,298)depreciation, amortisation, write-downs and write-backs 29 (43,308) (23,836)provisions for risks and charges, amounts released 18 (11,680) (3,274)total operatInG costs (1,092,789) (637,336)operatInG profIt 58,188 53,260fInancIal Income and charGesincome (charges) from investments carried at equity 9 416 2,942dividends, income and charges from disposal of equity investments 30 209 182financial income 31 2,714 3,802financial charges 32 (18,188) (21,527)exchange gains (losses) (103) (4)profit (loss) before taxation 43,236 38,655Current and deferred taxation 33 (27,892) (17,756)profit (loss) from continuing operations 15,344 20,899results from discontinued activities 15 (6) -net profit (loss) for the year 15,338 20,899net loss (profit) attributable to minority shareholders (221) (304)net profit (loss) attributable to the Group 15,117 20,595* this column presents restated information for the prior year after final allocation of the purchase price paid for the investment made in integra ifm bV on 23 december 2008(see note 3 for further information).118 - Consolidated finanCial statements as of 31 deCember <strong>2009</strong> Consolidated finanCial statements as of 31 deCember <strong>2009</strong> - 119