Financial Statements 2009 - Manutencoop
Financial Statements 2009 - Manutencoop
Financial Statements 2009 - Manutencoop

Create successful ePaper yourself
Turn your PDF publications into a flip-book with our unique Google optimized e-Paper software.
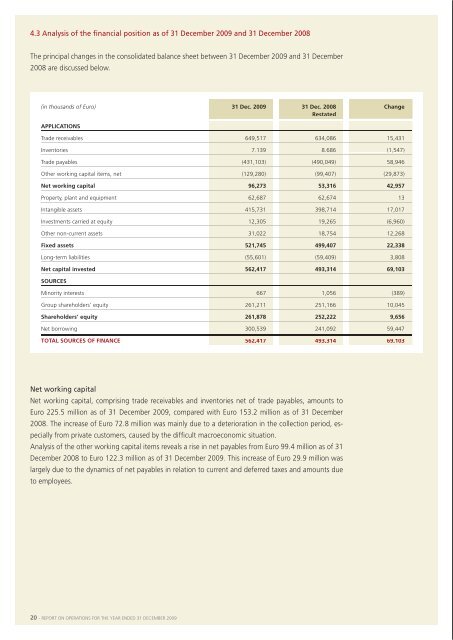
4.3 analysis of the financial position as of 31 december <strong>2009</strong> and 31 december 2008the principal changes in the consolidated balance sheet between 31 december <strong>2009</strong> and 31 december2008 are discussed below.net borrowingnet borrowing is analysed below as of 31 december <strong>2009</strong> and 31 december 2008.(in thousands of Euro) 31 dec. <strong>2009</strong> 31 dec. 2008 changerestatedapplicationstrade receivables 649,517 634,086 15,431inventories 7,139 8,686 (1,547)trade payables (431,103) (490,049) 58,946other working capital items, net (129,280) (99,407) (29,873)net working capital 96,273 53,316 42,957Property, plant and equipment 62,687 62,674 13intangible assets 415,731 398,714 17,017investments carried at equity 12,305 19,265 (6,960)other non-current assets 31,022 18,754 12,268fixed assets 521,745 499,407 22,338long-term liabilities (55,601) (59,409) 3,808net capital invested 562,417 493,314 69,103sources(in thousands of Euro) 31 dec. <strong>2009</strong> 31 dec. 2008 changea. Cash 649 669 (20)b. bank current accounts, deposits and consortium accounts 79,153 97,258 (18,105)d. liquidity (a) + (b) + (c) 79,802 97,927 (18,125)e. Current financial receivables 1,960 1,220 740f. Current bank borrowing (93,904) (81,453) (12,451)G. Current portion of non-current borrowing (50,377) (9,917) (40,460)h. other current financial payables (27,745) (19,161) (8,584)i. current borrowing (f)+(g)+(h) (172,026) (110,531) (61,495)J. current borrowing, net (i) – (e) – (d) (90,264) (11,384) (78,880)K. non-current bank borrowing (199,105) (229,708) 30,603l. other non-current financial payables (10,105) 0 (10,105)m. financial liabilities from derivatives (1,065) 0 (1,065)n. non-current borrowing, net (k) (210,275) (229,708) 19,433o. net borrowing (J) + (n) (300,539) (241,092) (59,447)minority interests 667 1,056 (389)Group shareholders’ equity 261,211 251,166 10,045shareholders’ equity 261,878 252,222 9,656net borrowing 300,539 241,092 59,447total sources of finance 562,417 493,314 69,103net working capitalnet working capital, comprising trade receivables and inventories net of trade payables, amounts toeuro 225.5 million as of 31 december <strong>2009</strong>, compared with euro 153.2 million as of 31 december2008. the increase of euro 72.8 million was mainly due to a deterioration in the collection period, especiallyfrom private customers, caused by the difficult macroeconomic situation.analysis of the other working capital items reveals a rise in net payables from euro 99.4 million as of 31december 2008 to euro 122.3 million as of 31 december <strong>2009</strong>. this increase of euro 29.9 million waslargely due to the dynamics of net payables in relation to current and deferred taxes and amounts dueto employees.net borrowing increased by euro 59.4 million in <strong>2009</strong>, from euro 241.1 million as of 31 december2008 to euro 300.5 million as of 31 december <strong>2009</strong>.this increase mainly reflects:> the recognition of contingent financial liabilities for price adjustments in relation to certain acquiredcompanies, which will be payable in 2014 if certain conditions are met (covering 80% of the sicuragroup), and the exercise prices of put options for the minority interests in the investments acquired(20% of the sicura group and 40% of Cofam), totalling euro 24.0 million;> the absorption of cash due to the above-mentioned increase in net working capital by euro 43.0million;> investment in property, plant and equipment and intangible assets totalling euro 28.1 million;> the cash flow generated by current operations of euro 75.3 million;> utilisation of provisions for risks and employee severance indemnities totalling euro 11.2 million;> distribution of dividends amounting to euro 4.1 million.capital investmentinvestment in property, plant and equipment and intangible assets during <strong>2009</strong> amounted to euro28.1 million, of which euro 2.6 million was allocated to intangible assets and euro 25.5 million toproperty, plant and equipment; this last amount mainly relates to the laundering and sterilisationsegment.by comparison, investment in 2008 amounted to euro 23.5 million, comprising intangible assets ofeuro 3.6 million and property, plant and equipment of euro 19.9 million.overall, capital investment in <strong>2009</strong> was euro 4.6 million greater than in the prior year. howeverinvestment in 2008 did not include that relating to the companies in the altair group controlled byintegra fm bV and the sicura group, or to Cofam s.r.l. or smail s.p.a., which were all acquired at theend of 2008.20 - rePort on oPerations for the year ended 31 deCember <strong>2009</strong> rePort on oPerations for the year ended 31 deCember <strong>2009</strong> - 21