Financial Statements 2009 - Manutencoop
Financial Statements 2009 - Manutencoop
Financial Statements 2009 - Manutencoop

Create successful ePaper yourself
Turn your PDF publications into a flip-book with our unique Google optimized e-Paper software.
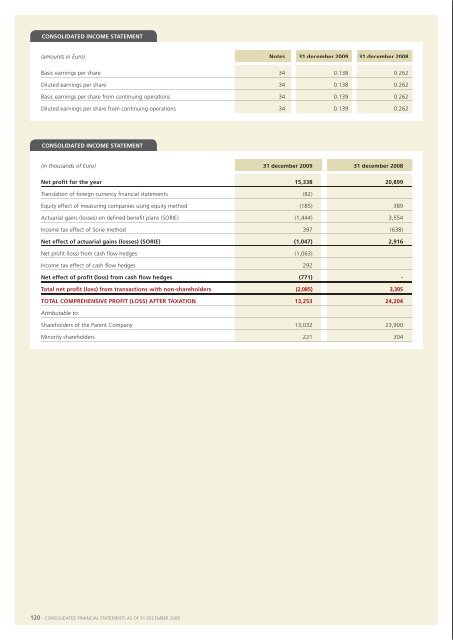
consolIdated Income statementconsolIdated cash floW statement(amounts in Euro) notes 31 december <strong>2009</strong> 31 december 2008 (in thousands of Euro) notes 31 december <strong>2009</strong> 31 december 2008basic earnings per share 34 0.138 0.262diluted earnings per share 34 0.138 0.262basic earnings per share from continuing operations 34 0.139 0.262diluted earnings per share from continuing operations 34 0.139 0.262profit before taxation 43,236 38,655depreciation, amortisation, write-downs (write-backs) 43,308 23,836provisions for risks (amounts released) 11,680 3,274provision for employee severance indemnities 2,788 727Charges (income) from investments carried at equity, net of dividends received 5,651 584taxes paid during the year (31,355) (14,889)consolIdated Income statement(in thousands of Euro) 31 december <strong>2009</strong> 31 december 2008net profit for the year 15,338 20,899translation of foreign currency financial statements (82)equity effect of measuring companies using equity method (185) 389actuarial gains (losses) on defined benefit plans (sorie) (1,444) 3,554income tax effect of sorie method 397 (638)net effect of actuarial gains (losses) (sorIe) (1,047) 2,916net profit (loss) from cash flow hedges (1,063)income tax effect of cash flow hedges 292net effect of profit (loss) from cash flow hedges (771) -total net profit (loss) from transactions with non-shareholders (2,085) 3,305total comprehensIVe profIt (loss) after taXatIon 13,253 24,204Attributable to:shareholders of the parent Company 13,032 23,900minority shareholders 221 304cash flow from current operations 75,308 52,187decrease (increase) in inventories 1,838 283decrease (increase) in trade receivables (18,030) (14,694)decrease (increase) in other operating assets 2,727 (1,160)Change in trade payables (59,221) 24,493Change in other operating liabilities 18,847 9,865utilisation of employee severance indemnities (6,157) (4,541)utilisation of provisions for risks and charges (5,085) (2,390)change in operating assets and liabilities (65,081) 11,856cash flow generated by operating activities 10,227 64,043(purchase of intangible assets) (2,636) (3,625)(purchase of property, plant and equipment) (25,598) (20,025)disposal of property, plant and equipment 2,108 744(net purchases of equity investments) 265 (10,558)long-term loans (granted) repaid (9,726) 160financial effects of business combinations 4 (5,479) (102,189)disposal of discontinued activities 15 1,513 0cash flow absorbed by investing activities (39,553) (135,493)net loans obtained (repaid) 15,283 (42,910)distribution of dividends (4,082) (3,664)Change in scope of consolidation 0 (1,338)increase in share capital and reserves 0 174,871cash flow generated by financing activities 11,201 126,959change in cash and cash equivalents (18,125) 55,509Cash and cash equivalents - start of year 97,927 42,418Change in cash and cash equivalents (18,125) 55,509cash and cash equivalents - end of year 79,802 97,927analysis of cash and cash equivalentsbank current accounts 79,802 97,927bank overdraftstotal cash and cash eQuIValents 79,802 97,927supplementary informationinterest paid (18,064) (21,273)interest received 2,714 3,802dividends collected 6,067 3,708120 - Consolidated finanCial statements as of 31 deCember <strong>2009</strong> Consolidated finanCial statements as of 31 deCember <strong>2009</strong> - 121