Financial Statements 2009 - Manutencoop
Financial Statements 2009 - Manutencoop
Financial Statements 2009 - Manutencoop

You also want an ePaper? Increase the reach of your titles
YUMPU automatically turns print PDFs into web optimized ePapers that Google loves.
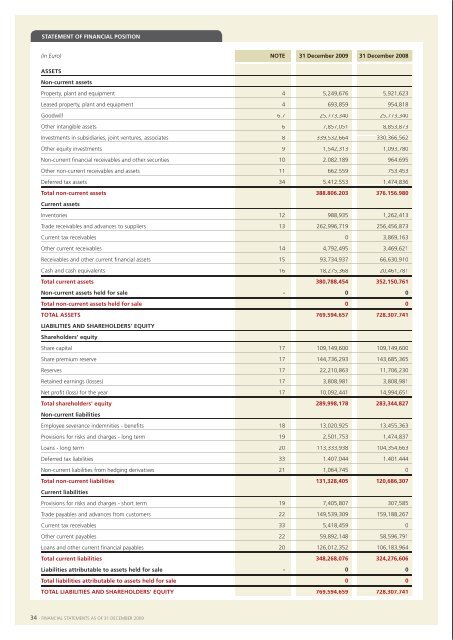
statement of fInanCIal posItIonseparate InCome statement(in Euro) note 31 december <strong>2009</strong> 31 december 2008 (in Euro) note 31 december <strong>2009</strong> 31 december 2008assetsnon-current assetsproperty, plant and equipment 4 5,249,676 5,921,623leased property, plant and equipment 4 693,859 954,818Goodwill 6.7 25,773,340 25,773,340other intangible assets 6 7,857,051 8,853,873investments in subsidiaries, joint ventures, associates 8 339,532,664 330,366,562other equity investments 9 1,542,313 1,093,780non-current financial receivables and other securities 10 2,082,189 964,695other non-current receivables and assets 11 662,559 753,453Deferred tax assets 34 5,412,553 1,474,836total non-current assets 388,806,203 376,156,980Current assetsinventories 12 988,935 1,262,413trade receivables and advances to suppliers 13 262,996,719 256,456,873current tax receivables 0 3,869,163other current receivables 14 4,792,495 3,469,621receivables and other current financial assets 15 93,734,937 66,630,910cash and cash equivalents 16 18,275,368 20,461,781total current assets 380,788,454 352,150,761non-current assets held for sale - 0 0total non-current assets held for sale 0 0total assets 769,594,657 728,307,741lIabIlItIes and shareholders' equItyshareholders' equityshare capital 17 109,149,600 109,149,600share premium reserve 17 144,736,293 143,685,365reserves 17 22,210,863 11,706,230retained earnings (losses) 17 3,808,981 3,808,981net profit (loss) for the year 17 10,092,441 14,994,651total shareholders' equity 289,998,178 283,344,827non-current liabilitiesemployee severance indemnities - benefits 18 13,020,925 13,455,363provisions for risks and charges - long term 19 2,501,753 1,474,837loans - long term 20 113,333,938 104,354,663Deferred tax liabilities 33 1,407,044 1,401,444non-current liabilities from hedging derivatives 21 1,064,745 0total non-current liabilities 131,328,405 120,686,307Current liabilitiesprovisions for risks and charges - short term 19 7,405,807 307,585trade payables and advances from customers 22 149,539,309 159,188,267current tax receivables 33 5,418,459 0other current payables 22 59,892,148 58,596,791loans and other current financial payables 20 126,012,352 106,183,964total current liabilities 348,268,076 324,276,606liabilities attributable to assets held for sale - 0 0total liabilities attributable to assets held for sale 0 0total lIabIlItIes and shareholders' equIty 769,594,659 728,307,741revenuesrevenues from sales and services 19 458,155,322 428,717,732other operating revenues 25 557,485 595,282total revenues 458,712,807 429,313,014operatIng Costsraw materials and consumables 26 (61,891,542) (60,643,748)services, leases and rentals 27 (167,905,650) (167,748,191)payroll costs 28 (186,803,011) (159,986,801)other operating costs 29 (3,191,351) (3,981,129)internal work capitalised - 0 0(Depreciation, amortisation, write-downs) - write-backs 30 (10,167,830) (4,209,342)(provisions for risks and charges) - amounts released 19 (8,650,878) (984,077)total operatIng Costs (438,610,261) (397,553,288)operatIng results 20,102,546 31,759,726fInanCIal InCome and ChargesDividends, income and charges from disposal of equity investments 31 9,551,146 6,959,088<strong>Financial</strong> income 32 3,139,881 3,140,146<strong>Financial</strong> charges 33 (10,851,032) (15,130,691)profit (loss) before taxation 21,942,541 26,728,269current and deferred taxation 34 (11,850,102) (11,733,617)results from continuing activities 10,092,438 14,994,652results from discontinued activities - 0 0net profit (loss) for the year 10,092,438 14,994,652statement of ComprehensIve InCome(in Euro) 31 december <strong>2009</strong> 31 december 2008net profit (loss) for the year 10,092,438 14,994,652equIty effeCt of measurIng CompanIes usIng equIty methodactuarial gains (losses) on defined benefit plans (sorie) (400,291) 2,156,000income tax effect 110,080 (592.900)net effect of actuarial gains (losses) (sorIe) (290,211) 1,563,100profits (losses) from cash flow hedges (1,064.745) 0income taxes 292,805 0net effect of profits (losses) from cash flow hedges (771,940) 0total ComprehensIve profIt (loss) after taXatIon 9,030,287 16,557,75234 - <strong>Financial</strong> statements as oF 31 December <strong>2009</strong> <strong>Financial</strong> statements as oF 31 December <strong>2009</strong> - 35