- Page 3:
UNIVERSIDAD DE SANTIAGO DE COMPOSTE
- Page 6 and 7:
padres Macario y Marisa, les agrade
- Page 8 and 9:
2.1.2. Nitrogen compounds 662.1.2.1
- Page 10:
Chapter 4: Combining UASB and MBR f
- Page 14 and 15:
Objetivos y resumenEsta tesis se en
- Page 16 and 17:
Objetivos y resumenpermeabilidad de
- Page 18 and 19:
Objetivos y resumenuno de los pará
- Page 20 and 21:
Objetivos y resumenel sistema propu
- Page 22:
Objetivos y resumenconcentraciones
- Page 25 and 26:
Obxectivos e resumoauga tratada. O
- Page 27 and 28:
Obxectivos e resumoNo Capítulo 3,
- Page 29 and 30:
Obxectivos e resumog·L -1 , valore
- Page 31 and 32:
Obxectivos e resumoparámetros clav
- Page 34 and 35:
Objectives and summaryThis thesis i
- Page 36 and 37:
Objectives and summaryOn the basis
- Page 38 and 39:
Objectives and summaryfrom the MBR
- Page 40 and 41:
Objectives and summaryconsidering t
- Page 42 and 43:
Chapter 1IntroductionSummaryIn this
- Page 44 and 45:
IntroductionThe combination of memb
- Page 46 and 47:
IntroductionThe membranes should ha
- Page 48 and 49:
Introductionof water. Energy saving
- Page 50 and 51:
number of plants (cum. values)Intro
- Page 52 and 53:
IntroductionSubmerged MBR system in
- Page 54 and 55:
Introductionchanges of the foulant
- Page 56 and 57:
Introductionof 2% NaOH and 0.5% cit
- Page 58 and 59:
IntroductionFigure 1.8. Posible rel
- Page 60 and 61:
IntroductionSide-stream MBRs involv
- Page 62 and 63: Introductionutilizes the advantages
- Page 64 and 65: Introductionmeans of settlers, of s
- Page 66 and 67: IntroductionUASB, achieving total n
- Page 68 and 69: IntroductionEvenblij, H., van der G
- Page 70 and 71: IntroductionMtinch, E.V., Ban, K.,
- Page 72: IntroductionYang, S., Yang, F., Fu,
- Page 75 and 76: Chapter 22.1. Liquid phaseIn this s
- Page 77 and 78: Chapter 2where:M fas: molarity of F
- Page 79 and 80: Acetic Acid (mg·L -1 )Chapter 2VFA
- Page 81 and 82: N-NO 2-(mg·L -1 )Chapter 22.1.2.2.
- Page 83 and 84: N-NO 3-(mg·L -1 )Chapter 2interfer
- Page 85 and 86: P-PO 43-(mg·L -1 )Chapter 2Interfe
- Page 87 and 88: Chapter 2alkalinity (IA), which is
- Page 89 and 90: Chapter 22.2.3. Sludge volumetric i
- Page 91 and 92: Chapter 2eq. 2.10eq. 2.11eq. 2.12Th
- Page 93 and 94: Carbohydrate (mg·L -1 )Chapter 2In
- Page 95 and 96: TEP (mgXG·L -1 )Chapter 22.4.4.4.
- Page 97 and 98: Chapter 2Ripley, L.E., Boyle, W.C.,
- Page 99 and 100: Chapter 33.1. IntroductionIn recent
- Page 101 and 102: Chapter 3same in both modules; tap
- Page 103 and 104: Chapter 3phases were varied (table
- Page 105 and 106: Chapter 3to time was higher than 10
- Page 107 and 108: COD removal (%)Chapter 3120100Perio
- Page 109 and 110: DTN and N-NH 4+ (mg·L-1 )DTN and N
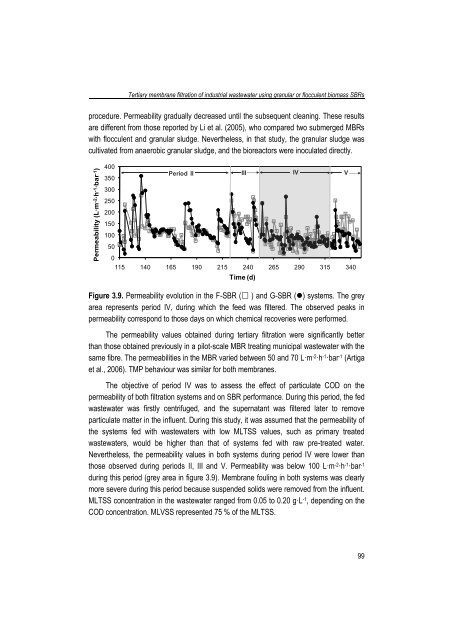
- Page 111: Chapter 3operated with high MLTSS c
- Page 115 and 116: SMP carbohydrates (mg·L -1 )Chapte
- Page 117 and 118: Volume (%)Chapter 3Therefore, the c
- Page 119 and 120: Chapter 3identical to that of the c
- Page 121 and 122: Chapter 3Massé, A. Spérandio, M.,
- Page 123 and 124: Chapter 44.1. IntroductionThe appli
- Page 125 and 126: Chapter 4support were added in this
- Page 127 and 128: Chapter 4This cleaning was performe
- Page 129 and 130: COD (mg·L -1 )COD removal (%)OLR (
- Page 131 and 132: Chapter 4the recirculation ratio be
- Page 133 and 134: (mg·L -1 )Chapter 4and ammonium) n
- Page 135 and 136: Chapter 4recirculation from the MBR
- Page 137 and 138: Chapter 4days 57 (period I) and 316
- Page 139 and 140: Chapter 4excellent COD removal perf
- Page 141 and 142: Chapter 4Rosenberger, S., Evenblij,
- Page 143 and 144: Chapter 55.1. IntroductionAnaerobic
- Page 145 and 146: Chapter 55.3. Material and methods5
- Page 147 and 148: Chapter 5represented an increment o
- Page 149 and 150: Chapter 5operating with similar mem
- Page 151 and 152: Chapter 5behaviour might be related
- Page 153 and 154: Fouling Rate (Pa·min -1 )Fouling R
- Page 155 and 156: Concentration (mg·L -1 )DOC (mg·L
- Page 157 and 158: Chapter 5in table 5.3 showed that h
- Page 159 and 160: Chapter 5Ho, J., Sung, S. 2010. Met
- Page 162 and 163:
Chapter 6Denitrification with disso
- Page 164 and 165:
Denitrification with dissolved meth
- Page 166 and 167:
Denitrification with dissolved meth
- Page 168 and 169:
Denitrification with dissolved meth
- Page 170 and 171:
Denitrification with dissolved meth
- Page 172 and 173:
Denitrification with dissolved meth
- Page 174 and 175:
(mg·L -1 )Denitrification with dis
- Page 176 and 177:
DTN effluent (mg·L -1 )CH 4 desorb
- Page 178 and 179:
Denitrification with dissolved meth
- Page 180 and 181:
Denitrification with dissolved meth
- Page 182 and 183:
Denitrification with dissolved meth
- Page 184 and 185:
Denitrification with dissolved meth
- Page 186 and 187:
Chapter 7Membrane fouling in an AnM
- Page 188 and 189:
Membrane fouling in an AnMBR treati
- Page 190 and 191:
Membrane fouling in an AnMBR treati
- Page 192 and 193:
Membrane fouling in an AnMBR treati
- Page 194 and 195:
OLR and ORR(kgCOD ·m -3·d -1 )pHO
- Page 196 and 197:
TEP removed (mg·L -1 )OA removed (
- Page 198 and 199:
R col (m -1 )SRF (m·kg -1 )Membran
- Page 200 and 201:
BPC, cBPC and TEP concentration(mg
- Page 202 and 203:
Cake and Colloidal Resistance (m -1
- Page 204 and 205:
Membrane fouling in an AnMBR treati
- Page 206 and 207:
Membrane fouling in an AnMBR treati
- Page 208:
Membrane fouling in an AnMBR treati
- Page 211 and 212:
Conclusionessentido, el uso de una
- Page 213 and 214:
Conclusionesensuciamiento de la mem
- Page 215 and 216:
Conclusiónspresenza de soporte de
- Page 217 and 218:
Conclusións6. Aplicabilidade e per
- Page 219 and 220:
ConclusionsMoreover, biomass concen
- Page 221 and 222:
Conclusionstechnology and interesti
- Page 223 and 224:
List of symbolsHFHRTHyVABHollow Fib
- Page 225 and 226:
List of symbolsFR/J Normalized Foul
- Page 227 and 228:
List of publicationsBrand, C., Sán
- Page 229:
List of publicationsConference on E