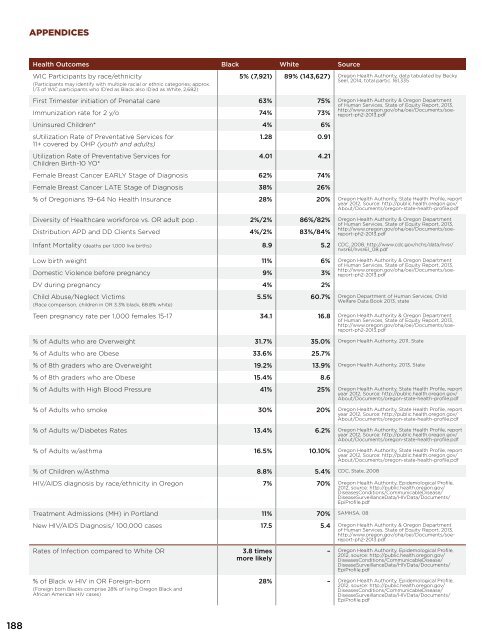
APPENDICESHealth Outcomes <strong>Black</strong> White SourceWIC Participants by race/ethnicity(Participants may identify with multiple racial or ethnic categories; approx.1/3 of WIC participants who ID’ed as <strong>Black</strong> also ID’ed as White, 2,682)5% (7,921) 89% (143,627) <strong>Oregon</strong> Health Authority, data tabulated by BeckySeel, 2014, total partic. 161,335sUtilization Rate of Preventative Services for11+ covered by OHP (youth and adults)Utilization Rate of Preventative Services forChildren Birth-10 YO*1.28 0.914.01 4.21Female Breast Cancer EARLY Stage of Diagnosis 62% 74%Female Breast Cancer LATE Stage of Diagnosis 38% 26%% of <strong>Oregon</strong>ians 19–64 No Health Insurance 28% 20% <strong>Oregon</strong> Health Authority, <strong>State</strong> Health Profile, reportyear 2012, Source: http://public.health.oregon.gov/About/Documents/oregon-state-health-profile.pdfInfant Mortality (deaths per 1,000 live births) 8.9 5.2 CDC, 2008, http://www.cdc.gov/nchs/data/nvsr/nvsr61/nvsr61_08.pdfFirst Trimester initiation of Prenatal care 63% 75% <strong>Oregon</strong> Health Authority & <strong>Oregon</strong> Departmentof Human Services, <strong>State</strong> of Equity Report, 2013,Immunization rate for 2 y/o 74% 73%http://www.oregon.gov/oha/oei/Documents/soereport-ph2-2013.pdfUninsured Children* 4% 6%Diversity of Healthcare workforce vs. OR adult pop . 2%/2% 86%/82% <strong>Oregon</strong> Health Authority & <strong>Oregon</strong> Departmentof Human Services, <strong>State</strong> of Equity Report, 2013,http://www.oregon.gov/oha/oei/Documents/soereport-ph2-2013.pdfDistribution APD and DD Clients Served 4%/2% 83%/84%Low birth weight 11% 6% <strong>Oregon</strong> Health Authority & <strong>Oregon</strong> Departmentof Human Services, <strong>State</strong> of Equity Report, 2013,Domestic Violence before pregnancy 9% 3%http://www.oregon.gov/oha/oei/Documents/soereport-ph2-2013.pdfDV during pregnancy 4% 2%Child Abuse/Neglect Victims(Race comparison, children in OR 3.3% black, 68.8% white)5.5% 60.7% <strong>Oregon</strong> Department of Human Services, ChildWelfare Data Book 2013, stateTeen pregnancy rate per 1,000 females 15-17 34.1 16.8 <strong>Oregon</strong> Health Authority & <strong>Oregon</strong> Departmentof Human Services, <strong>State</strong> of Equity Report, 2013,http://www.oregon.gov/oha/oei/Documents/soereport-ph2-2013.pdf% of Adults who are Overweight 31.7% 35.0% <strong>Oregon</strong> Health Authority, 2011, <strong>State</strong>% of Adults who are Obese 33.6% 25.7%% of 8th graders who are Overweight 19.2% 13.9% <strong>Oregon</strong> Health Authority, 2013, <strong>State</strong>% of 8th graders who are Obese 15.4% 8.6% of Adults with High Blood Pressure 41% 25% <strong>Oregon</strong> Health Authority, <strong>State</strong> Health Profile, reportyear 2012, Source: http://public.health.oregon.gov/About/Documents/oregon-state-health-profile.pdf% of Adults who smoke 30% 20% <strong>Oregon</strong> Health Authority, <strong>State</strong> Health Profile, reportyear 2012, Source: http://public.health.oregon.gov/About/Documents/oregon-state-health-profile.pdf% of Adults w/Diabetes Rates 13.4% 6.2% <strong>Oregon</strong> Health Authority, <strong>State</strong> Health Profile, reportyear 2012, Source: http://public.health.oregon.gov/About/Documents/oregon-state-health-profile.pdf% of Adults w/asthma 16.5% 10.10% <strong>Oregon</strong> Health Authority, <strong>State</strong> Health Profile, reportyear 2012, Source: http://public.health.oregon.gov/About/Documents/oregon-state-health-profile.pdf% of Children w/Asthma 8.8% 5.4% CDC, <strong>State</strong>, 2008HIV/AIDS diagnosis by race/ethnicity in <strong>Oregon</strong> 7% 70% <strong>Oregon</strong> Health Authority, Epidemological Profile,2012, source: http://public.health.oregon.gov/DiseasesConditions/CommunicableDisease/DiseaseSurveillanceData/HIVData/Documents/EpiProfile.pdfTreatment Admissions (MH) in Portland 11% 70% SAMHSA, 08New HIV/AIDS Diagnosis/ 100,000 cases 17.5 5.4 <strong>Oregon</strong> Health Authority & <strong>Oregon</strong> Departmentof Human Services, <strong>State</strong> of Equity Report, 2013,http://www.oregon.gov/oha/oei/Documents/soereport-ph2-2013.pdfRates of Infection compared to White OR% of <strong>Black</strong> w HIV in OR Foreign-born(Foreign born <strong>Black</strong>s comprise 28% of living <strong>Oregon</strong> <strong>Black</strong> andAfrican American HIV cases)3.8 timesmore likely– <strong>Oregon</strong> Health Authority, Epidemological Profile,2012, source: http://public.health.oregon.gov/DiseasesConditions/CommunicableDisease/DiseaseSurveillanceData/HIVData/Documents/EpiProfile.pdf28% – <strong>Oregon</strong> Health Authority, Epidemological Profile,2012, source: http://public.health.oregon.gov/DiseasesConditions/CommunicableDisease/DiseaseSurveillanceData/HIVData/Documents/EpiProfile.pdf188
Health Outcomes <strong>Black</strong> White SourceChlamydia incidence per 100K 900 ~220 <strong>Oregon</strong> Health Authority, <strong>State</strong> Health Profile, reportyear 2012, Source: http://public.health.oregon.gov/About/Documents/oregon-state-health-profile.pdfYears of Life Lost before age 75 7,708 6,047 <strong>Oregon</strong> Health Authority & <strong>Oregon</strong> Departmentof Human Services, <strong>State</strong> of Equity Report, 2013,http://www.oregon.gov/oha/oei/Documents/soereport-ph2-2013.pdfHomicide Rates per 100,000 7 2.6 <strong>Oregon</strong> Health Authority, Violent Death ReportingSystem, report year 2012, source: https://public.health.oregon.gov/DiseasesConditions/InjuryFatalityData/Documents/NVDRS/Violent-Deaths-%20in-%20<strong>Oregon</strong>-%202012.pdfSuicide Rates per 100,000 6 21.4 <strong>Oregon</strong> Health Authority, Violent Death ReportingSystem, report year 2012, source: https://public.health.oregon.gov/DiseasesConditions/InjuryFatalityData/Documents/NVDRS/Violent-Deaths-%20in-%20<strong>Oregon</strong>-%202012.pdf5 year Avg Homicide Rate among males (per 100k) 12.4 2.9 <strong>Oregon</strong> Health Authority & <strong>Oregon</strong> Departmentof Human Services, <strong>State</strong> of Equity Report, 2013,http://www.oregon.gov/oha/oei/Documents/soereport-ph2-2013.pdfFirearm fatality rate per 100,000 7 13 <strong>Oregon</strong> Health Authority, Violent Death ReportingSystem, report year 2012, source: https://public.health.oregon.gov/DiseasesConditions/InjuryFatalityData/Documents/NVDRS/Violent-Deaths-%20in-%20<strong>Oregon</strong>-%202012.pdfViolent Death Rate per 100,000 15 26.8 <strong>Oregon</strong> Health Authority, Violent Death ReportingSystem, report year 2012, source: https://public.health.oregon.gov/DiseasesConditions/InjuryFatalityData/Documents/NVDRS/Violent-Deaths-%20in-%20<strong>Oregon</strong>-%202012.pdfHealth Coverage <strong>Black</strong> White SourceHealth Coverage – Private 53.3% 69.9% PRC, 2012Health Coverage – Public 39.4% 32.4%Health Coverage – No Health insurance 15.2% 12.9%Source: U.S. Census Bureau: 2012 American Community Survey, 1 - Year Estimate, Table S02011 Margins of error are not shown in this table.189
- Page 1 and 2:
STATE OFBLACKOREGON2015
- Page 5:
FOREWORDThe State of Black Oregon 2
- Page 8 and 9:
ACKNOWLEDGMENTSWe gratefully acknow
- Page 10 and 11:
+ CONTENTSIntroduction 10SECTION 1:
- Page 12 and 13:
Chapter 5 92 GROWING A WORKFORCEEss
- Page 14 and 15:
INTRODUCTIONSTATE OF BLACK OREGON 2
- Page 17 and 18:
SECTION 1CHILDREN& YOUTHCHAPTER 1 1
- Page 19 and 20:
ACTION VISIONThe best way to streng
- Page 21 and 22:
FAMILY-BASED CARE AND SUPPORTAll fa
- Page 23 and 24:
CRITICAL SUPPORT FOR BLACK MOTHERSP
- Page 25 and 26:
interface with these stressed syste
- Page 28 and 29:
CASE STUDY 2AFRICAN & AFRICAN AMERI
- Page 30 and 31:
HOUSING AND EDUCATIONAL IMPLICATION
- Page 32 and 33:
POLICY ACTIONSThe best way to stren
- Page 34 and 35:
CHAPTER 2PROTECT & EDUCATEFor Black
- Page 36 and 37:
ESSAY 3THE POWER OF IMAGEKali Thorn
- Page 38:
ESSAY 4REBUILDING STRONG SUPPORTSFO
- Page 41 and 42:
REROUTING THE SCHOOL-TO-PRISON PIPE
- Page 43 and 44:
“We have a powerful potential in
- Page 46:
CASE STUDY 4TRAILBLAZING A PATHWAY
- Page 49 and 50:
graders, mostly from Lane County. A
- Page 52 and 53:
BLACK MALE ACHIEVEMENT IN MULTNOMAH
- Page 54 and 55:
POLICY ACTIONSEvery child should be
- Page 56 and 57:
CHAPTER 3PREPARE, SUPPORT & EMPLOYT
- Page 58 and 59:
ESSAY 6CREATING OPPORTUNITIES INSCH
- Page 60 and 61:
ESSAY 7PREPARING BLACK YOUTHFOR THE
- Page 62:
CASE STUDY 6MAKING EDUCATION AFFORD
- Page 66:
OREGON SNAPSHOT“DON’T FORGET AB
- Page 69 and 70:
De Marcus Preston, community non-vi
- Page 71:
“Where there isno vision, there i
- Page 74 and 75:
CHAPTER 4SECURITY AND WELL-BEINGEmp
- Page 76 and 77:
ESSAY 8AN ECONOMIC JUSTICEFOUNDATIO
- Page 78 and 79:
ESSAY 9HOLISTIC SOLUTIONS FORINCLUS
- Page 80 and 81:
BLACK IMMIGRANTS & REFUGEES,COMMUNI
- Page 82:
CASE STUDY 8BELINDA JILES IS CONNEC
- Page 85 and 86:
PEOPLE WITH DISABILITIESIn Oregon13
- Page 87 and 88:
point—you decide to acquiesce. Yo
- Page 89 and 90:
PERCENT OF POPULATION LIVING WITHIN
- Page 91 and 92:
data since the 1980s. The data are
- Page 93 and 94:
A coach in area high schools for si
- Page 95 and 96:
“We are caught in aninescapable n
- Page 97 and 98:
ACTION VISIONAs the Oregon private
- Page 99 and 100:
community-based and collaborative s
- Page 101 and 102:
Kimberlin ButlerPresident, Urban Le
- Page 103 and 104:
Building to offer real apprenticesh
- Page 105 and 106:
101
- Page 107 and 108:
103
- Page 109 and 110:
Labor Commissioner Brad Avakian say
- Page 111 and 112:
107
- Page 113 and 114:
Work-Ready Communities, we must fir
- Page 115 and 116:
111
- Page 117 and 118:
ACTION VISIONStrengthening financia
- Page 119 and 120:
Stephen Green at theOregon Public H
- Page 121 and 122:
INTERGENERATIONAL CHANGES, INTERGEN
- Page 123 and 124:
UPWARD MOBILITY43%of Americans born
- Page 125 and 126:
participants in a White supremacist
- Page 127 and 128:
Kayin and Cleo Davis of SoapboxTheo
- Page 129 and 130:
this also limited his productivity.
- Page 131 and 132:
Much of the town’s economy depend
- Page 133 and 134:
“What the peoplewant is very simp
- Page 135 and 136:
SECTION 3COMMUNITYCHAPTER 7 132PROT
- Page 137 and 138:
ACTION VISIONUrban renewal, law enf
- Page 139 and 140:
Dr. Lisa K. Bates at the work siteo
- Page 141 and 142: A BLACK-CENTEREDAPPROACHTO PLANNING
- Page 143 and 144: JUVENILE JUSTICEIn Oregon, Black yo
- Page 145 and 146: TAKING ACTION FOR BLACK IMMIGRANT &
- Page 147 and 148: 3. Appropriate discipline, includin
- Page 149 and 150: 145
- Page 151 and 152: There are also tensions left over f
- Page 153 and 154: Gwendolyn does, however, see potent
- Page 155 and 156: 151
- Page 157 and 158: she was 6 years old, and her father
- Page 159 and 160: • Adopting of the HUD mandate toA
- Page 161 and 162: 157
- Page 163 and 164: ELECTORAL POLITICS• Elect decisio
- Page 165 and 166: ehind educationally and being expel
- Page 167 and 168: OVERCOMING BARRIERS TO CIVIC ENGAGE
- Page 169 and 170: encouraging other news outlets to a
- Page 171 and 172: 167
- Page 173 and 174: DIRECT SERVICEDEFINITION: This appr
- Page 175 and 176: APPENDICES171
- Page 177 and 178: APPENDIX AREPORT FRAMING, POLICY AC
- Page 179 and 180: 10. Oregon’s school-to-prison pip
- Page 181 and 182: CHAPTER 61. United States Census Bu
- Page 183 and 184: DemographicsOregon Profile Black #
- Page 185 and 186: Median Household Income (change ove
- Page 187 and 188: Arrests and Incarceration Black Whi
- Page 189 and 190: School Profile Black White Of Color
- Page 191: Foster Care and Adoption Black Whit
- Page 195 and 196: APPENDIX DBLACK OLDER ADULTS FOCUS
- Page 197 and 198: APPENDIX FMETHODOLOGY AND LIMITATIO
- Page 200: Published byURBAN LEAGUEOF PORTLAND