Department of Transport Annual Report 2010 - 2011
Department of Transport Annual Report 2010 - 2011
Department of Transport Annual Report 2010 - 2011
Create successful ePaper yourself
Turn your PDF publications into a flip-book with our unique Google optimized e-Paper software.
Services and key effectiveness indicators for Goal 2<br />
Service 3: Strategic transport policy<br />
Key efficiency indicators<br />
Average cost per policy hour<br />
for strategic transport policy<br />
development.<br />
<strong>2010</strong>-11<br />
target<br />
<strong>2010</strong>-11<br />
actual<br />
$118.25 $109.78<br />
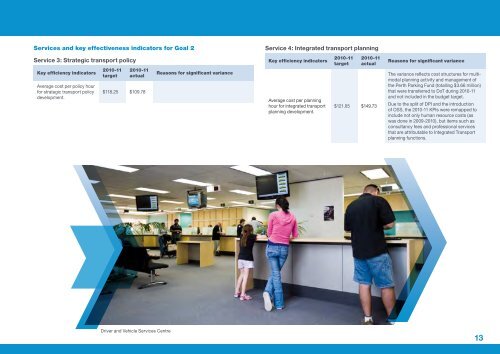
Driver and Vehicle Services Centre<br />
Reasons for significant variance<br />
Service 4: Integrated transport planning<br />
Key efficiency indicators<br />
Average cost per planning<br />
hour for integrated transport<br />
planning development.<br />
<strong>2010</strong>-11<br />
target<br />
<strong>2010</strong>-11<br />
actual<br />
$121.05 $149.73<br />
Reasons for significant variance<br />
The variance reflects cost structures for multimodal<br />
planning activity and management <strong>of</strong><br />
the Perth Parking Fund (totalling $3.66 million)<br />
that were transferred to DoT during <strong>2010</strong>-11<br />
and not included in the budget target.<br />
Due to the split <strong>of</strong> DPI and the introduction<br />
<strong>of</strong> OSS, the <strong>2010</strong>-11 KPIs were remapped to<br />
include not only human resource costs (as<br />
was done in 2009-<strong>2010</strong>), but items such as<br />
consultancy fees and pr<strong>of</strong>essional services<br />
that are attributable to Integrated <strong>Transport</strong><br />
planning functions.<br />
13


