- Page 8: 12.1.3 Prompt Treatment of Fever in
- Page 12: Table 3.5.1 Employment status: Wome
- Page 16 and 17: Table 13.8.1 Multiple sexual partne
- Page 18 and 19: Figure 16.1 Number of Decisions in
- Page 20 and 21: PREFACEThis detailed report present
- Page 22 and 23: FAMILY PLANNINGKnowledge of family
- Page 24 and 25: laria is also seasonal, occurring m
- Page 26: xxviii | Map of Swaziland
- Page 33 and 34: Because of the anonymous nature of
- Page 35 and 36: HOUSEHOLD POPULATION AND HOUSING2CH
- Page 37 and 38: given. Households in Swaziland are
- Page 39: Table 2.3.2 Educational attainment
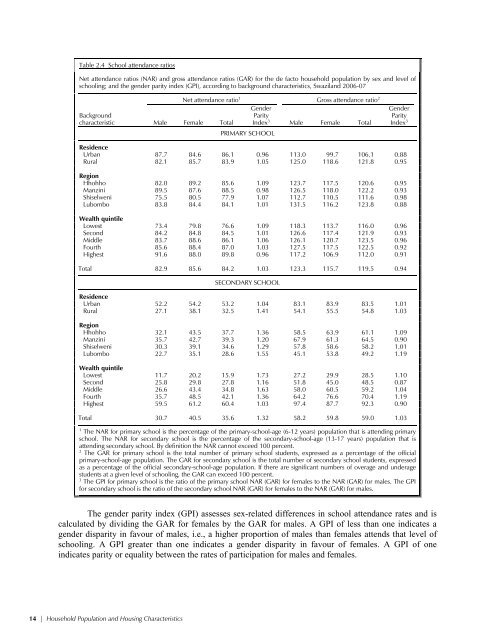
- Page 43 and 44: The dropout rates are higher for bo
- Page 45 and 46: 2.4.2 Household Sanitation Faciliti
- Page 47 and 48: Table 2.8—ContinuedHousingHouseho
- Page 49 and 50: Table 2.10 Household possessionsPer
- Page 51 and 52: Table 2.11 presents the percentage
- Page 53 and 54: Table 3.1.1 Background characterist
- Page 55 and 56: 3.2 EDUCATIONAL ATTAINMENT BY BACKG
- Page 57 and 58: Table 3.3.1 Literacy: Women 15-49Pe
- Page 59 and 60: Table 3.3.4 Literacy: Older adults
- Page 61 and 62: Table 3.4.2 Exposure to mass media:
- Page 63 and 64: The pattern of exposure to mass med
- Page 65 and 66: Table 3.5.1 Employment status: Wome
- Page 67 and 68: Table 3.5.2 Employment status: Men
- Page 69 and 70: 3.6 OCCUPATIONRespondents who were
- Page 71 and 72: Table 3.6.3 shows the percent distr
- Page 73 and 74: Six in ten women and 72 percent of
- Page 75 and 76: for women in the age group 30-34 (1
- Page 77 and 78: Nonetheless, the results in Table 4
- Page 79 and 80: 4.6 BIRTH INTERVALSA birth interval
- Page 81 and 82: Overall, 6 percent of women age 25-
- Page 83 and 84: There are notable regional differen
- Page 85 and 86: Table 5.1 Knowledge of contraceptiv
- Page 87 and 88: 62 | Family PlanningTable 5.3.1 Eve
- Page 89 and 90: Table 5.3.2 Ever use of contracepti
- Page 91 and 92:
Figure 5.2 compares the modern cont
- Page 93 and 94:
9080706050403020100Figure 5.3 Contr
- Page 95 and 96:
Table 5.7 Number of children at fir
- Page 97 and 98:
consistent, asking informants in th
- Page 99 and 100:
Table 5.13 Informed choiceAmong cur
- Page 101 and 102:
5.14 PREFERRED METHOD OF CONTRACEPT
- Page 103 and 104:
Table 5.17.2 Exposure to family pla
- Page 105 and 106:
Table 5.19 Husband/partner's knowle
- Page 107 and 108:
OTHER PROXIMATE DETERMINANTS OF FER
- Page 109 and 110:
Table 6.2 Polygyny: Women and men a
- Page 111 and 112:
Table 6.4 Age at first marriage: Wo
- Page 113 and 114:
Eleven percent of women age 25-49 h
- Page 115 and 116:
The data for men show a different p
- Page 117 and 118:
Table 6.10.2 Recent sexual activity
- Page 119 and 120:
Women who gave birth three years pr
- Page 121 and 122:
FERTILITY PREFERENCES 7Dudu Dlamini
- Page 123 and 124:
Table 7.2.1 Desire to limit childbe
- Page 125 and 126:
Overall, unmet need does not vary i
- Page 127 and 128:
7.5 MEAN IDEAL NUMBER OF CHILDREN B
- Page 129 and 130:
The total wanted fertility rate and
- Page 131 and 132:
Tables C.4-C.6 in Appendix C can be
- Page 133 and 134:
Figure 8.2 Neonatal, Postneonatal,
- Page 135 and 136:
Table 8.3 Early childhood mortality
- Page 137 and 138:
common single high-risk category is
- Page 139 and 140:
Table 9.1 Antenatal care providerPe
- Page 141 and 142:
Table 9.3 Components of antenatal c
- Page 143 and 144:
While older women of higher parity
- Page 145 and 146:
Table 9.6 Assistance during deliver
- Page 147 and 148:
Table 9.7 Timing of first postnatal
- Page 149 and 150:
accessing health services. Other li
- Page 151 and 152:
10.2.1 Collection of DataThe 2006-0
- Page 153 and 154:
PercentFigure 10.1 Trend in Vaccina
- Page 155 and 156:
Table 10.4 presents the proportions
- Page 157 and 158:
Table 10.5 Prevalence of diarrhoeaP
- Page 159 and 160:
Antibiotics and other medications a
- Page 161 and 162:
10.5 KNOWLEDGE OF ORS PACKETSAs dis
- Page 163 and 164:
NUTRITION OF CHILDREN AND ADULTS 11
- Page 165 and 166:
Table 11.1—ContinuedBackgroundcha
- Page 167 and 168:
during the first three days after b
- Page 169 and 170:
SDHS by asking mothers about the fo
- Page 171 and 172:
Table 11.4 Median duration and freq
- Page 173 and 174:
The results in Table 11.5 document
- Page 175 and 176:
Figure 11.2 Percentage of Children
- Page 177 and 178:
years and above. Severe anaemia, wh
- Page 179 and 180:
Table 11.8.2—ContinuedBackgroundc
- Page 181 and 182:
Table 11.9 Micronutrient intake amo
- Page 183 and 184:
iodized salt. Manzini had the lowes
- Page 185 and 186:
directly related to household wealt
- Page 187 and 188:
The results in Table 11.12.2 indica
- Page 189 and 190:
11.12 MICRONUTRIENT INTAKE AMONG MO
- Page 191 and 192:
MALARIA AND OTHER HEALTH ISSUES 12A
- Page 193 and 194:
Tables 12.2 and 12.3 provide inform
- Page 195 and 196:
Table 12.4 provides information on
- Page 197 and 198:
12.1.4 Indoor Residual SprayingIndo
- Page 199 and 200:
Slightly less than two-thirds of me
- Page 201 and 202:
Table 12.9.2 Health insurance cover
- Page 203 and 204:
Table 12.10.2 Knowledge and attitud
- Page 205 and 206:
HIV/AIDS-RELATED KNOWLEDGE, ATTITUD
- Page 207 and 208:
Table 13.2 Knowledge of HIV prevent
- Page 209 and 210:
Table 13.3.1 Comprehensive knowledg
- Page 211 and 212:
Table 13.4 shows that a relatively
- Page 213 and 214:
Table 13.5.2 Accepting attitudes to
- Page 215 and 216:
13.6 ATTITUDES TOWARDS CONDOM EDUCA
- Page 217 and 218:
Table 13.8.2 Multiple sexual partne
- Page 219 and 220:
Consistent use of condoms requires,
- Page 221 and 222:
Table 13.11.2 Coverage of prior HIV
- Page 223 and 224:
Table 13.13 Pregnant women counsell
- Page 225 and 226:
100Figure 13.1 Women and Men Seekin
- Page 227 and 228:
administered injections with a syri
- Page 229 and 230:
13.11.2 Knowledge of Condom Sources
- Page 231 and 232:
Table 13.20 Condom use at first sex
- Page 233 and 234:
Table 13.22.1 Higher-risk sexual in
- Page 235 and 236:
wealth quintile, especially among w
- Page 237 and 238:
13.11.9 HIV Testing and Counselling
- Page 239 and 240:
Table 14.1 Coverage of HIV testing
- Page 241 and 242:
Table 14.2 Coverage of HIV testing
- Page 243 and 244:
Looking at the age pattern, Table 1
- Page 245 and 246:
The HIV epidemic also exhibits some
- Page 247 and 248:
Table 14.6.1 HIV prevalence by demo
- Page 249 and 250:
As expected, men who sleep away fro
- Page 251 and 252:
Table 14.7.2 HIV prevalence by sexu
- Page 253 and 254:
Table 14.7.3 HIV prevalence by sexu
- Page 255 and 256:
The uptake of HIV testing in Swazil
- Page 257 and 258:
Table 14.11 HIV prevalence by backg
- Page 259 and 260:
14.6 HIV PREVALENCE AMONG COUPLESBo
- Page 261 and 262:
Of the 25,594 siblings reported in
- Page 263 and 264:
The results in Table 15.3 indicate
- Page 265 and 266:
“no” to this question were aske
- Page 267 and 268:
Older women and women with more chi
- Page 269 and 270:
Table 16.3 Women's control over the
- Page 271 and 272:
Figure 16.1 Number of Decisions in
- Page 273 and 274:
Differentials by region and wealth
- Page 275 and 276:
Table 16.7.1 Attitude toward refusi
- Page 277 and 278:
There are small differences by back
- Page 279 and 280:
Table 16.9 Current use of contracep
- Page 281 and 282:
Table 16.11 Reproductive health car
- Page 283 and 284:
ORPHANS AND VULNERABLE CHILDREN 17A
- Page 285 and 286:
Table 17.2 Orphans and vulnerable c
- Page 287 and 288:
There is only a minor difference in
- Page 289 and 290:
Table 17.6 Underweight orphans and
- Page 291 and 292:
17.8 WIDOWS DISPOSSESSED OFPROPERTY
- Page 293 and 294:
17.10 EXTERNAL SUPPORT FOR ORPHANS
- Page 295 and 296:
18.1 CAREGIVERTable 18.1 shows the
- Page 297 and 298:
Some parents or guardians take the
- Page 299 and 300:
Girls and boys age 12-14 were asked
- Page 301 and 302:
Figure 18.2 shows the percentage of
- Page 303 and 304:
Table 18.7 Exposure to information
- Page 305 and 306:
Table 18.9 Places for information a
- Page 307 and 308:
18.7 KNOWLEDGE OF HIV/AIDS HELP LIN
- Page 309 and 310:
When asked if they had discussed th
- Page 311 and 312:
REFERENCESAuvert, B., D. Taljaard,
- Page 313 and 314:
SAMPLE IMPLEMENTATIONAppendix ATabl
- Page 315 and 316:
Table A.3 Sample implementation: Gi
- Page 317 and 318:
Table A.5 Sample implementation: Wo
- Page 319 and 320:
ESTIMATES OF SAMPLING ERRORSAppendi
- Page 321 and 322:
Sampling errors are analyzed for tw
- Page 323 and 324:
Table B.1—Continued--------------
- Page 325 and 326:
Table B.2—Continued--------------
- Page 327 and 328:
Table B.3—Continued--------------
- Page 329 and 330:
Table B.4—Continued--------------
- Page 331 and 332:
Table B.5—Continued--------------
- Page 333 and 334:
Table B.6—Continued--------------
- Page 335 and 336:
Table B.7—Continued--------------
- Page 337 and 338:
Table B.8—Continued--------------
- Page 339 and 340:
DATA QUALITY TABLESAppendix CTable
- Page 341 and 342:
Table C.3 Completeness of reporting
- Page 343 and 344:
EFFECT OF NONRESPONSE ON THESDHS HI
- Page 345 and 346:
PERSONS INVOLVED IN THE 2006-07SWAZ
- Page 347 and 348:
Mr. Musa DlaminiMr. Patrick Makhubu
- Page 350 and 351:
2006 SWAZILAND DEMOGRAPHIC AND HEAL
- Page 352 and 353:
LINENO.IF AGE 18-59YEARSIF AGE 0-17
- Page 354 and 355:
LINENO.IF AGE 5 YEARS OR OLDERIF AG
- Page 356 and 357:
NO. QUESTIONS AND FILTERS CODING CA
- Page 358 and 359:
NO. QUESTIONS AND FILTERS CODING CA
- Page 360 and 361:
NO. QUESTIONS AND FILTERS CODING CA
- Page 362 and 363:
1ST SICK PERSON 2ND SICK PERSON 3RD
- Page 364 and 365:
NAME 1ST DEATH NAME 2ND DEATH NAME
- Page 366 and 367:
405 RECORD NAMES, LINE NUMBERS AND
- Page 368 and 369:
CONSENT STATEMENT FOR ANAEMIA FOR C
- Page 370 and 371:
CHILD 4 CHILD 5 CHILD 6502 LINE NUM
- Page 372 and 373:
CHILD 4 CHILD 5 CHILD 6502 LINE NUM
- Page 374 and 375:
CONSENT STATEMENT FOR ANAEMIA TEST
- Page 376 and 377:
WEIGHT, HEIGHT, HAEMOGLOBIN MEASURE
- Page 378 and 379:
WOMAN 4 WOMAN 5 WOMAN 6524 LINE NUM
- Page 380 and 381:
We are asking children like you to
- Page 382 and 383:
WEIGHT, HEIGHT, HAEMOGLOBIN MEASURE
- Page 384 and 385:
MAN 1 MAN 2 MAN 3544 LINE NUMBER LI
- Page 386 and 387:
2006 SWAZILAND DEMOGRAPHIC AND HEAL
- Page 388 and 389:
NO. QUESTIONS AND FILTERS CODING CA
- Page 390 and 391:
211 Now I would like to record the
- Page 392 and 393:
NO. QUESTIONS AND FILTERS CODING CA
- Page 394 and 395:
SECTION 3. CONTRACEPTION301 Now I w
- Page 396 and 397:
NO. QUESTIONS AND FILTERS CODING CA
- Page 398 and 399:
NO. QUESTIONS AND FILTERS CODING CA
- Page 400 and 401:
SECTION 4. PREGNANCY, POSTNATAL CAR
- Page 402 and 403:
LAST BIRTH NEXT-TO- SECOND-FROM-LAS
- Page 404 and 405:
LAST BIRTH NEXT-TO- SECOND-FROM-LAS
- Page 406 and 407:
LAST BIRTH NEXT-TO- SECOND-FROM-LAS
- Page 408 and 409:
LAST BIRTH NEXT-TO- SECOND-FROM-LAS
- Page 410 and 411:
SECTION 5. IMMUNIZATION, HEALTH, AN
- Page 412 and 413:
LAST BIRTH NEXT-TO-LAST BIRTH SECON
- Page 414 and 415:
LAST BIRTH NEXT-TO-LAST BIRTH SECON
- Page 416 and 417:
LAST BIRTH NEXT-TO-LAST BIRTH SECON
- Page 418 and 419:
NO. QUESTIONS AND FILTERS CODING CA
- Page 420 and 421:
SECTION 6. MARRIAGE AND SEXUAL ACTI
- Page 422 and 423:
NO. QUESTIONS AND FILTERS CODING CA
- Page 424 and 425:
LASTSEXUAL PARTNERSECOND-TO-LASTSEX
- Page 426 and 427:
NO. QUESTIONS AND FILTERS CODING CA
- Page 428 and 429:
NO. QUESTIONS AND FILTERS CODING CA
- Page 430 and 431:
NO. QUESTIONS AND FILTERS CODING CA
- Page 432 and 433:
NO. QUESTIONS AND FILTERS CODING CA
- Page 434 and 435:
SECTION 9. HIV/AIDSNO. QUESTIONS AN
- Page 436 and 437:
NO. QUESTIONS AND FILTERS CODING CA
- Page 438 and 439:
NO. QUESTIONS AND FILTERS CODING CA
- Page 440 and 441:
SECTION 10. OTHER SEXUALLY TRANSMIT
- Page 442 and 443:
NO. QUESTIONS AND FILTERS CODING CA
- Page 444 and 445:
NO. QUESTIONS AND FILTERS CODING CA
- Page 446 and 447:
SECTION 12. MATERNAL MORTALITYNO. Q
- Page 448 and 449:
INSTRUCTIONS:ONLY ONE CODE SHOULD A
- Page 450 and 451:
2006 SWAZILAND DEMOGRAPHIC AND HEAL
- Page 452 and 453:
NO. QUESTIONS AND FILTERS CODING CA
- Page 454 and 455:
SECTION 3. CONTRACEPTION301 Now I w
- Page 456 and 457:
SECTION 4. MARRIAGE AND SEXUAL ACTI
- Page 458 and 459:
LASTSEXUAL PARTNERSECOND-TO-LASTSEX
- Page 460 and 461:
NO. QUESTIONS AND FILTERS CODING CA
- Page 462 and 463:
NO. QUESTIONS AND FILTERS CODING CA
- Page 464 and 465:
SECTION 5. FERTILITY PREFERENCESNO.
- Page 466 and 467:
NO. QUESTIONS AND FILTERS CODING CA
- Page 468 and 469:
NO. QUESTIONS AND FILTERS CODING CA
- Page 470 and 471:
NO. QUESTIONS AND FILTERS CODING CA
- Page 472 and 473:
NO. QUESTIONS AND FILTERS CODING CA
- Page 474 and 475:
NO. QUESTIONS AND FILTERS CODING CA
- Page 476:
INTERVIEWER'S OBSERVATIONSTO BE FIL
- Page 479 and 480:
SECTION 1. RESPONDENT'S BACKGROUNDI
- Page 481 and 482:
SECTION 2. CARE AND PROTECTIONNO. Q
- Page 483 and 484:
NO. QUESTIONS AND FILTERS CODING CA
- Page 485 and 486:
SECTION 4. KNOWLEDGE OF AIDSNO. QUE
- Page 487 and 488:
NO. QUESTIONS AND FILTERS CODING CA
- Page 489 and 490:
INTERVIEWER'S OBSERVATIONSTO BE FIL
- Page 491 and 492:
SECTION 1. RESPONDENT'S BACKGROUNDI
- Page 493 and 494:
SECTION 2. MARRIAGE AND SEXUAL ACTI
- Page 495 and 496:
SECTION 3. MARRIAGE AND SEXUAL ACTI
- Page 497 and 498:
NO. QUESTIONS AND FILTERS CODING CA
- Page 499 and 500:
SECTION 4. HIV/AIDSNO. QUESTIONS AN
- Page 501 and 502:
NO. QUESTIONS AND FILTERS CODING CA
- Page 503 and 504:
SECTION 5. OTHER SEXUALLY TRANSMITT
- Page 505 and 506:
NO. QUESTIONS AND FILTERS CODING CA
- Page 507:
INTERVIEWER'S OBSERVATIONSTO BE FIL