
Create successful ePaper yourself
Turn your PDF publications into a flip-book with our unique Google optimized e-Paper software.
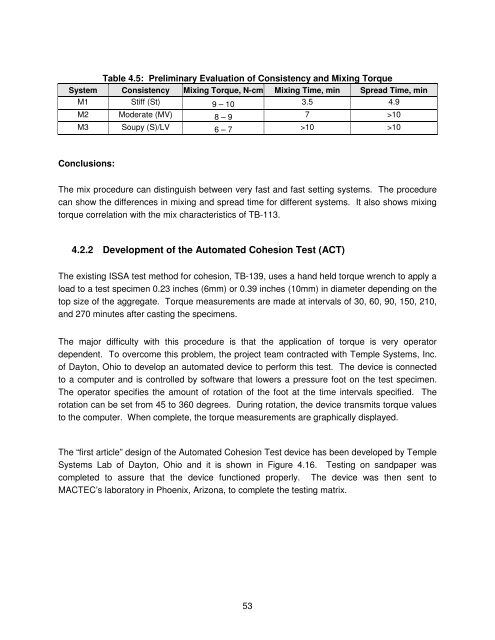
Table 4.5: Preliminary Evaluation of Consistency and Mixing Torque<br />
System Consistency Mixing Torque, N-cm Mixing Time, min Spread Time, min<br />
M1 Stiff (St) 9 – 10 3.5 4.9<br />
M2 Moderate (MV) 8 – 9 7 >10<br />
M3 Soupy (S)/LV 6 – 7 >10 >10<br />
Conclusions:<br />
The mix procedure can distinguish between very fast and fast setting systems. The procedure<br />
can show the differences in mixing and spread time for different systems. It also shows mixing<br />
torque correlation with the mix characteristics of TB-113.<br />
4.2.2 Development of the Automated Cohesion Test (ACT)<br />
The existing ISSA test method for cohesion, TB-139, uses a hand held torque wrench to apply a<br />
load to a test specimen 0.23 inches (6mm) or 0.39 inches (10mm) in diameter depending on the<br />
top size of the aggregate. Torque measurements are made at intervals of 30, 60, 90, 150, 210,<br />
and 270 minutes after casting the specimens.<br />
The major difficulty with this procedure is that the application of torque is very operator<br />
dependent. To overcome this problem, the project team contracted with Temple Systems, Inc.<br />
of Dayton, Ohio to develop an automated device to perform this test. The device is connected<br />
to a computer and is controlled by software that lowers a pressure foot on the test specimen.<br />
The operator specifies the amount of rotation of the foot at the time intervals specified. The<br />
rotation can be set from 45 to 360 degrees. During rotation, the device transmits torque values<br />
to the computer. When complete, the torque measurements are graphically displayed.<br />
The “first article” design of the Automated Cohesion Test device has been developed by Temple<br />
Systems Lab of Dayton, Ohio and it is shown in Figure 4.16. Testing on sandpaper was<br />
completed to assure that the device functioned properly. The device was then sent to<br />
MACTEC’s laboratory in Phoenix, Arizona, to complete the testing matrix.<br />
53