- Page 1 and 2:
PHASE II REPORT Slurry Seal / Micro
- Page 3 and 4:
CALTRANS Fugro Consultants, Inc. Co
- Page 5 and 6:
CALTRANS Fugro Consultants, Inc. Co
- Page 7 and 8:
For the Phase II work, the research
- Page 9 and 10:
2.0 CHAPTER 2 INTRODUCTION 2.1 BACK
- Page 11 and 12:
3.0 Findings from the ruggedness te
- Page 13 and 14:
START Test Mix Components Accept Ma
- Page 15 and 16:
For all the above considerations, t
- Page 17 and 18: Type II and III microsurfacings are
- Page 19 and 20: “M” Refers to an ASSHTO Standar
- Page 21 and 22: Viscosity: A property of the mix th
- Page 23 and 24: 3.6.2 The European Mixing Test Base
- Page 25 and 26: Mix Torque kg-cm 70 60 50 40 30 20
- Page 27 and 28: Clamping Pressure 200Kpa Interface
- Page 29 and 30: Samples Holes 0.8 inches (~0.20 mm
- Page 31 and 32: • Abrasion: CAT. This test may be
- Page 33 and 34: 3.7.1 Step 1: Materials Selection T
- Page 35 and 36: 3.7.6 Step 6: Evaluate the Long Ter
- Page 37 and 38: 4.2 LABORATORY TEST METHODS DEVELOP
- Page 39 and 40: Table 4.2.2: TB-113 Results for Mix
- Page 41 and 42: In addition to the “base mixture
- Page 43 and 44: The resulting mix had the following
- Page 45 and 46: Features: Produces a tangential flo
- Page 47 and 48: Mixing Containers type and size: a.
- Page 49 and 50: • 50 rpm mixing speed This config
- Page 51 and 52: The shape of the traces for differe
- Page 53 and 54: Figure 4.10: Mix M4 Trace with Stan
- Page 55 and 56: The recommended mixing procedure fo
- Page 57 and 58: Figure 4.14: AMT Trace for Mix M1,
- Page 59 and 60: Figure 4.16: Automated Cohesion Tes
- Page 61 and 62: As illustrated in Figures 4.17 and
- Page 63 and 64: Note that the ratio of the two aver
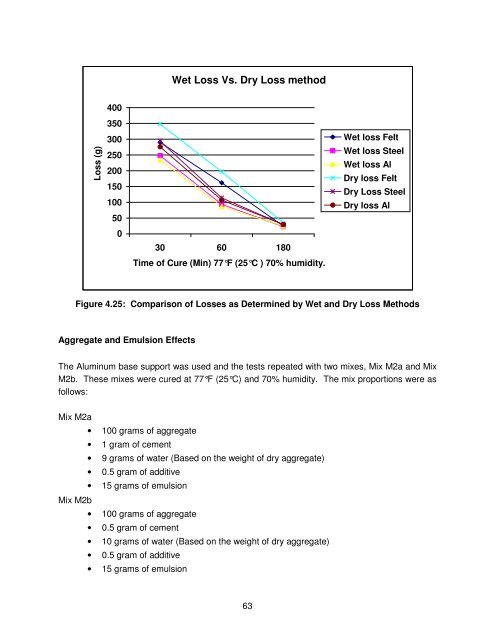
- Page 65 and 66: • Dry Loss Method - Two identical
- Page 67: Loss (%) 35 30 20 15 10 5 0 Effect
- Page 71 and 72: Both systems were correctly defined
- Page 73 and 74: Time (Min) Wet Loss M1 (g) Table 4.
- Page 75 and 76: observation. For long term abrasion
- Page 77 and 78: 4.3.2 Evaluation of Cohesion-Abrasi
- Page 79 and 80: 4.4 REVISED MIX DESIGN METHOD (VERS
- Page 81 and 82: Step 5: Evaluate the Cohesion Prope
- Page 83 and 84: 5.0 CHAPTER 5 RUGGEDNESS TESTING 5.
- Page 85 and 86: These levels will be far enough apa
- Page 87 and 88: 5.3.3 ACT Test For this test, the c
- Page 89 and 90: 6.1.2 AGGREGATE Mineral aggregate s
- Page 91 and 92: shall perform the mix design. The p
- Page 93 and 94: 6.5.2 TEST STRIP. With the coordina
- Page 95 and 96: 6.6.5 MACHINE CALIBRATION. Each uni
- Page 97 and 98: 6.7 METHOD OF MEASUREMENT 6.7.1 ARE
- Page 99 and 100: Delays in the progress of the resea
- Page 101 and 102: 2.4 IDA Werke EUROSTAR Power contro
- Page 103 and 104: 4.3 If the mix does not break, the
- Page 105 and 106: 8.0 PROCEDURE 8.1 Maintain the aggr
- Page 107 and 108: 11.2.1.1 BT: brown color transfer t
- Page 109 and 110: Note: Closing all other programs ru
- Page 111 and 112: − Eurostar mixer - the parameter
- Page 113 and 114: Figure A.5: Display of Functional U
- Page 115 and 116: To stop the test, select the drop d
- Page 117 and 118: 2.3 ISSA TB-100, Test Method for We
- Page 119 and 120:
5.4 Suitable specimen casting mold
- Page 121 and 122:
8.2 The amounts of material compone
- Page 123 and 124:
9.2 Completely cover the specimen w
- Page 125 and 126:
APPENDIX C RESULTS OF RUGGEDNESS AM
- Page 127 and 128:
Figure C.2: Ruggedness Trials Trial
- Page 129 and 130:
Figure C.4: Ruggedness Trials Trial
- Page 131 and 132:
CEL#: 10-17749 LAB #: Date Tested:
- Page 133 and 134:
CEL#: 10-17749 LAB #: Date Tested:
- Page 135 and 136:
CEL#: 10-17749 LAB #: Date Tested:
- Page 137 and 138:
CEL#: 10-17749 LAB #: Date Tested:
- Page 139 and 140:
CAT: COHESION ABRASION TEST (FRENCH
- Page 141 and 142:
CEL#: 10-17749 LAB #: Date Tested:
- Page 143 and 144:
CEL#: 10-17749 LAB #: Date Tested:
- Page 145 and 146:
CEL#: 10-17749 LAB #: Date Tested:
- Page 147 and 148:
CEL#: 10-17749 LAB #: Date Tested:
- Page 149 and 150:
2.CAT-Cohesion Abrasion Test: Frenc
- Page 151 and 152:
GRADATION ANALYSIS FOR AGGREGATE A1
- Page 153 and 154:
GRADATION ANALYSIS FOR AGGREGATE A1
- Page 155 and 156:
GRADATION ANALYSIS FOR AGGREGATE A1
- Page 157 and 158:
GRADATION ANALYSIS FOR AGGREGATE A1
- Page 159 and 160:
GRADATION ANALYSIS FOR AGGREGATE A1
- Page 161 and 162:
Source: Lopke (A2) Aggregate: ISSA
- Page 163 and 164:
Source: Lopke (A2) Aggregate: ISSA
- Page 165 and 166:
Source: Lopke (A2) Aggregate: ISSA
- Page 167 and 168:
Source: Lopke (A2) Aggregate: ISSA
- Page 169 and 170:
Source: Lopke (A2) Aggregate: ISSA
- Page 171 and 172:
GRADATION ANALYSES FOR AGGREGATE A3
- Page 173 and 174:
GRADATION ANALYSES FOR AGGREGATE A3
- Page 175 and 176:
GRADATION ANALYSES FOR AGGREGATE A3
- Page 177 and 178:
GRADATION ANALYSES FOR AGGREGATE A3
- Page 179 and 180:
GRADATION ANALYSES FOR AGGREGATE A3
- Page 181 and 182:
SODIUM SULFATE SOUNDNESS FOR AGGREG
- Page 183 and 184:
SODIUM SULFATE SOUNDNESS FOR AGGREG
- Page 185 and 186:
ABRASION LOSS BY AASHTO T-96 FOR AG
- Page 187 and 188:
SAND EQUIVALENT FOR AGGREGATES A1,
- Page 189 and 190:
ABRASION LOSS BY ASTM D6928 FOR AGG
- Page 191 and 192:
CEL# 10-17749 Source: Sem Materials
- Page 193 and 194:
CEL# 10-17749 Source: VSS Emultech
- Page 195 and 196:
CEL# 10-17749 Source: Ergon Materia
- Page 197 and 198:
Automated Mixing Test Mix: M3 Agg:
- Page 199 and 200:
CEL#: 10-17749 1)apply tack coat to
- Page 201 and 202:
CEL#: 10-17749 1)apply tack coat to
- Page 203 and 204:
CEL#: 10-17749 1)apply tack coat to
- Page 205 and 206:
CEL#: 10-17749 1)apply tack coat to
- Page 207 and 208:
CEL#: 10-17749 1)apply tack coat to
- Page 209 and 210:
CEL#: 10-17749 1)apply tack coat to
- Page 211 and 212:
CEL#: 10-17749 1)apply tack coat to
- Page 213 and 214:
CEL#: 10-17749 1)apply tack coat to
- Page 215 and 216:
CEL#: 10-17749 1)apply tack coat to
- Page 217 and 218:
CEL#: 10-17749 1)apply tack coat to
- Page 219 and 220:
CEL#: 10-17749 1)apply tack coat to
- Page 221 and 222:
CEL#: 10-17749 1)apply tack coat to
- Page 223 and 224:
CEL#: 10-17749 1)apply tack coat to
- Page 225 and 226:
CEL#: 10-17749 1)apply tack coat to
- Page 227 and 228:
CEL#: 10-17749 1)apply tack coat to
- Page 229 and 230:
Aggregates: Emulsions: Mixes: CAT R
- Page 231 and 232:
ACT RESULTS FOR ALL MIXES TEST RESU
- Page 233 and 234:
ACT RESULTS FOR ALL MIXES 228
- Page 235 and 236:
ACT RESULTS FOR ALL MIXES 230
- Page 237 and 238:
ACT RESULTS FOR ALL MIXES 232
- Page 239 and 240:
ACT RESULTS FOR ALL MIXES 234
- Page 241 and 242:
ACT RESULTS FOR ALL MIXES 236
- Page 243 and 244:
ACT RESULTS FOR ALL MIXES 238
- Page 245 and 246:
ACT RESULTS FOR ALL MIXES 240
- Page 247 and 248:
not effective if placed on pavement
- Page 249 and 250:
Table F.1: Draft Outline for Refere
- Page 251 and 252:
David Peshkin will take the lead in
- Page 253 and 254:
Ride quality has been shown to impa
- Page 255 and 256:
agency will be held prior to constr
- Page 257 and 258:
An agency that desires to participa


