FEDERAL
Sixth Semiannual Report to the Congress - Federal Housing ...
Sixth Semiannual Report to the Congress - Federal Housing ...
- No tags were found...

Create successful ePaper yourself
Turn your PDF publications into a flip-book with our unique Google optimized e-Paper software.
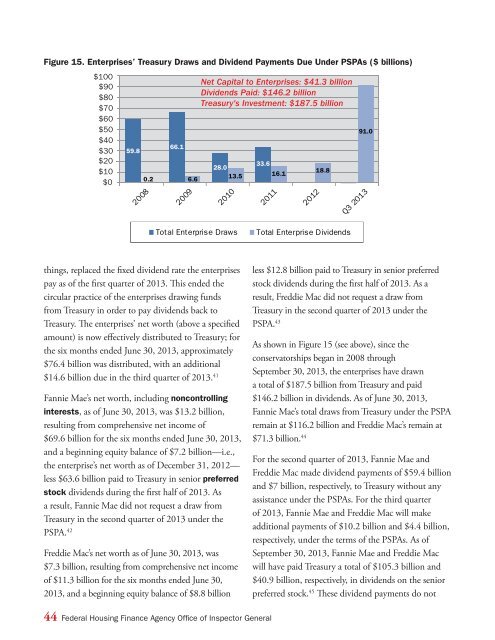
Figure 15. Enterprises’ Treasury Draws and Dividend Payments Due Under PSPAs ($ billions)<br />
$100<br />
$90<br />
$80<br />
$70<br />
$60<br />
$50<br />
$40<br />
$30<br />
$20<br />
$10<br />
$0<br />
59.8<br />
0.2<br />
2008<br />
66.1<br />
6.6<br />
2009<br />
Net Capital to Enterprises: $41.3 billion<br />
Dividends Paid: $146.2 billion<br />
Treasury's Investment: $187.5 billion<br />
33.6<br />
28.0<br />
13.5 16.1<br />
2010<br />
2011<br />
2012<br />
18.8<br />
91.0<br />
Q3 2013<br />
Total Enterprise Draws<br />
Total Enterprise Dividends<br />
things, replaced the fixed dividend rate the enterprises<br />
pay as of the first quarter of 2013. This ended the<br />
circular practice of the enterprises drawing funds<br />
from Treasury in order to pay dividends back to<br />
Treasury. The enterprises’ net worth (above a specified<br />
amount) is now effectively distributed to Treasury; for<br />
the six months ended June 30, 2013, approximately<br />
$76.4 billion was distributed, with an additional<br />
$14.6 billion due in the third quarter of 2013. 41<br />
Freddie Mac’s net worth as of June 30, 2013, was<br />
$7.3 billion, resulting from comprehensive net income<br />
of $11.3 billion for the six months ended June 30,<br />
2013, and a beginning equity balance of $8.8 billion<br />
less $12.8 billion paid to Treasury in senior preferred<br />
stock dividends during the first half of 2013. As a<br />
result, Freddie Mac did not request a draw from<br />
Treasury in the second quarter of 2013 under the<br />
PSPA. 43<br />
As shown in Figure 15 (see above), since the<br />
conservatorships began in 2008 through<br />
September 30, 2013, the enterprises have drawn<br />
a total of $187.5 billion from Treasury and paid<br />
Fannie Mae’s net worth, including noncontrolling $146.2 billion in dividends. As of June 30, 2013,<br />
interests,<br />
Figure<br />
as<br />
15.<br />
of June<br />
Enterprises'<br />
30, 2013, was<br />
Treasury<br />
$13.2 billion,<br />
Draws and Dividend<br />
Fannie Mae’s<br />
Payments<br />
total draws<br />
Due<br />
from<br />
Under<br />
Treasury<br />
PSPAs<br />
under the PSPA<br />
resulting from comprehensive net income of remain at $116.2 billion and Freddie Mac’s remain at<br />
$69.6 billion for the six months ended June 30, 2013, $71.3 billion. 44<br />
and a beginning equity balance of $7.2 billion—i.e.,<br />
the enterprise’s net worth as of December 31, 2012—<br />
less $63.6 billion paid to Treasury in senior preferred<br />
stock dividends during the first half of 2013. As<br />
a result, Fannie Mae did not request a draw from<br />
Treasury in the second quarter of 2013 under the<br />
PSPA. 42<br />
For the second quarter of 2013, Fannie Mae and<br />
Freddie Mac made dividend payments of $59.4 billion<br />
and $7 billion, respectively, to Treasury without any<br />
assistance under the PSPAs. For the third quarter<br />
of 2013, Fannie Mae and Freddie Mac will make<br />
additional payments of $10.2 billion and $4.4 billion,<br />
respectively, under the terms of the PSPAs. As of<br />
September 30, 2013, Fannie Mae and Freddie Mac<br />
will have paid Treasury a total of $105.3 billion and<br />
$40.9 billion, respectively, in dividends on the senior<br />
preferred stock. 45 These dividend payments do not<br />
44 Federal Housing Finance Agency Office of Inspector General