FEDERAL
Sixth Semiannual Report to the Congress - Federal Housing ...
Sixth Semiannual Report to the Congress - Federal Housing ...
- No tags were found...

Create successful ePaper yourself
Turn your PDF publications into a flip-book with our unique Google optimized e-Paper software.
Figure 17. FHLBanks’ Net Income for the Six<br />
Months Ended June 30, 2013 and 2012 ($ millions)<br />
2013 2012<br />
Net Interest Income $1,682 $2,048<br />
Reversal of (Provision for)<br />
Credit Losses<br />
10 (13)<br />
Other-than-Temporary<br />
Impairment Losses a (6) (86)<br />
Other Income (Loss) 189 (31)<br />
Total Non-interest Expense (421) (485)<br />
Total Assessments (144) (148)<br />
Net Income $1,310 $1,285<br />
a<br />
Of the other-than-temporary impairment losses, private-label<br />
MBS comprised $6 million and $84 million for the six months<br />
ended June 30, 2013 and 2012, respectively.<br />
derive from decreases in interest income on advances,<br />
held-to-maturity securities, prepayment fees,<br />
and mortgage loans. Interest income on advances<br />
decreased from $1.6 billion to $1.3 billion—i.e.,<br />
21%—and interest income on held-to-maturity<br />
securities decreased from $1.3 billion to<br />
$1.1 billion—a 19% decline—for the six months<br />
ended June 30, 2013, compared with the same period<br />
in 2012. Also during this period, interest income<br />
on prepayment fees was reduced from $158 million<br />
to $64 million—or 59%—and interest income<br />
on mortgage loans decreased from $1.1 billion to<br />
$969 million—a 15% decline, compared with the<br />
same period in 2012. 65<br />
On the other hand, a decrease in interest expense from<br />
$3.2 billion to $2.6 billion—i.e., 20%—prevented<br />
additional declines in net interest income. The decrease<br />
was driven by lower funding costs and reductions in the<br />
balances of interest-bearing liabilities. The refinancing<br />
of consolidated obligations, which resulted in lower<br />
interest payments, was a key contributor to this decline.<br />
Due to these lower payments, consolidated obligation<br />
expenses decreased from $3.1 billion to $2.4 billion,<br />
or 22%, for the six months ended June 30, 2013,<br />
compared with the same period in 2012. 66<br />
The FHLBanks are exposed to interest rate risk<br />
primarily from the effect of interest rate changes on<br />
their interest-earning assets, as well as the funding<br />
sources for these assets. The goal of the FHLBanks<br />
is not to eliminate interest rate risk entirely but to<br />
manage it within appropriate limits. To achieve this<br />
goal, the FHLBanks use derivatives (e.g., interest<br />
rate swaps, options, and swaptions), which help<br />
reduce funding costs, maintain favorable interest rates,<br />
and manage overall assets and liabilities. 67<br />
Changes in mark-to-market items prevented further<br />
declines in overall profitability, adding gains on<br />
derivatives and hedging activities. Specifically, the<br />
gains accounted for additional non-interest income<br />
of $293 million for the six months ended June 30,<br />
2013, compared with a loss of $1 million for the same<br />
period in 2012—a substantial increase. 68<br />
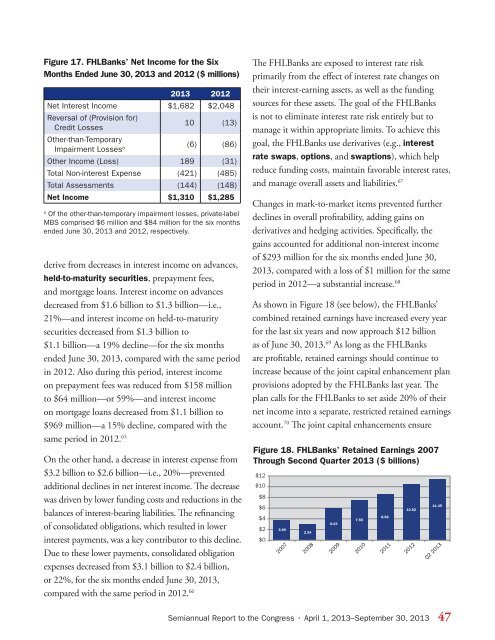
As shown in Figure 18 (see below), the FHLBanks’<br />
combined retained earnings have increased every year<br />
for the last six years and now approach $12 billion<br />
as of June 30, 2013. 69 As long as the FHLBanks<br />
are profitable, retained earnings should continue to<br />
increase because of the joint capital enhancement plan<br />
provisions adopted by the FHLBanks last year. The<br />
plan calls for the FHLBanks to set aside 20% of their<br />
net income into a separate, restricted retained earnings<br />
account. 70 The joint capital enhancements ensure<br />
Figure 18. FHLBanks’ Retained Earnings 2007<br />
Through Second Quarter 2013 ($ billions)<br />
$12<br />
$10<br />
$8<br />
$6<br />
$4<br />
$2<br />
$0<br />
3.69<br />
2007<br />
2.94<br />
2008<br />
6.03<br />
2009<br />
7.55<br />
2010<br />
8.58<br />
2011<br />
10.52<br />
2012<br />
11.45<br />
Q2 2013<br />
Semiannual Report to the Congress • April 1, 2013–September 30, 2013 47