Mathur Ritika Passi
zVAWsQ
zVAWsQ

Create successful ePaper yourself
Turn your PDF publications into a flip-book with our unique Google optimized e-Paper software.
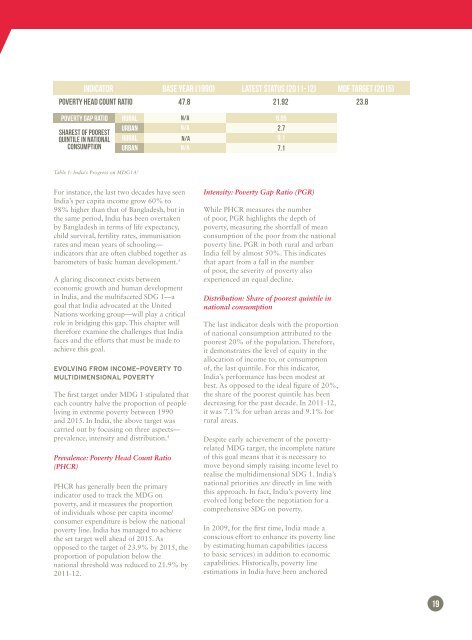
INDICATOR BASE YEAR (1990) LATEST STATUS (2011-12) MDF TARGET (2015)<br />
POVERTY HEAD COUNT RATIO 47.8 21.92 23.8<br />
POVERTY GAP RATIO<br />
SHAREST OF POOREST<br />
QUINTILE IN NATIONAL<br />
CONSUMPTION<br />
RURAL<br />
URBAN<br />
RURAL<br />
URBAN<br />
N/A 5.05<br />
N/A 2.7<br />
N/A 9.1<br />
N/A 7.1<br />
Table 1: India’s Progress on MDG1A 5<br />
For instance, the last two decades have seen<br />
India’s per capita income grow 60% to<br />
98% higher than that of Bangladesh, but in<br />
the same period, India has been overtaken<br />
by Bangladesh in terms of life expectancy,<br />
child survival, fertility rates, immunisation<br />
rates and mean years of schooling—<br />
indicators that are often clubbed together as<br />
barometers of basic human development. 3<br />
A glaring disconnect exists between<br />
economic growth and human development<br />
in India, and the multifaceted SDG 1—a<br />
goal that India advocated at the United<br />
Nations working group—will play a critical<br />
role in bridging this gap. This chapter will<br />
therefore examine the challenges that India<br />
faces and the efforts that must be made to<br />
achieve this goal.<br />
Evolving from Income-Poverty to<br />
Multidimensional Poverty<br />
The first target under MDG 1 stipulated that<br />
each country halve the proportion of people<br />
living in extreme poverty between 1990<br />
and 2015. In India, the above target was<br />
carried out by focusing on three aspects—<br />
prevalence, intensity and distribution. 4<br />
Prevalence: Poverty Head Count Ratio<br />
(PHCR)<br />
PHCR has generally been the primary<br />
indicator used to track the MDG on<br />
poverty, and it measures the proportion<br />
of individuals whose per capita income/<br />
consumer expenditure is below the national<br />
poverty line. India has managed to achieve<br />
the set target well ahead of 2015. As<br />
opposed to the target of 23.9% by 2015, the<br />
proportion of population below the<br />
national threshold was reduced to 21.9% by<br />
2011-12.<br />
Intensity: Poverty Gap Ratio (PGR)<br />
While PHCR measures the number<br />
of poor, PGR highlights the depth of<br />
poverty, measuring the shortfall of mean<br />
consumption of the poor from the national<br />
poverty line. PGR in both rural and urban<br />
India fell by almost 50%. This indicates<br />
that apart from a fall in the number<br />
of poor, the severity of poverty also<br />
experienced an equal decline.<br />
Distribution: Share of poorest quintile in<br />
national consumption<br />
The last indicator deals with the proportion<br />
of national consumption attributed to the<br />
poorest 20% of the population. Therefore,<br />
it demonstrates the level of equity in the<br />
allocation of income to, or consumption<br />
of, the last quintile. For this indicator,<br />
India’s performance has been modest at<br />
best. As opposed to the ideal figure of 20%,<br />
the share of the poorest quintile has been<br />
decreasing for the past decade. In 2011-12,<br />
it was 7.1% for urban areas and 9.1% for<br />
rural areas.<br />
Despite early achievement of the povertyrelated<br />
MDG target, the incomplete nature<br />
of this goal means that it is necessary to<br />
move beyond simply raising income level to<br />
realise the multidimensional SDG 1. India’s<br />
national priorities are directly in line with<br />
this approach. In fact, India’s poverty line<br />
evolved long before the negotiation for a<br />
comprehensive SDG on poverty.<br />
In 2009, for the first time, India made a<br />
conscious effort to enhance its poverty line<br />
by estimating human capabilities (access<br />
to basic services) in addition to economic<br />
capabilities. Historically, poverty line<br />
estimations in India have been anchored<br />
19