Clarksville- Main File

Create successful ePaper yourself
Turn your PDF publications into a flip-book with our unique Google optimized e-Paper software.
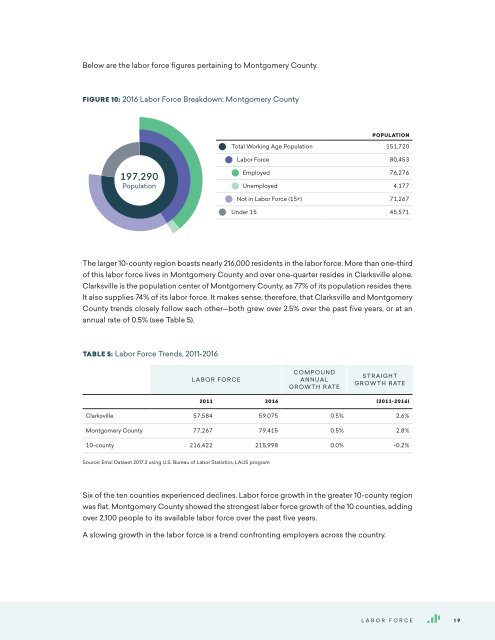
Below are the labor force figures pertaining to Montgomery County.<br />
39+2+K 41+36+K 77+23+H<br />
FIGURE 10: 2016 Labor Force Breakdown: Montgomery County<br />
197,290<br />
Population<br />
POPULATION<br />
Total Working Age Population 151,720<br />
Labor Force 80,453<br />
Employed 76,276<br />
Unemployed 4,177<br />
Not in Labor Force (15+) 71,267<br />
Under 15 45,571<br />
The larger 10-county region boasts nearly 216,000 residents in the labor force. More than one-third<br />
of this labor force lives in Montgomery County and over one-quarter resides in <strong>Clarksville</strong> alone.<br />
<strong>Clarksville</strong> is the population center of Montgomery County, as 77% of its population resides there.<br />
It also supplies 74% of its labor force. It makes sense, therefore, that <strong>Clarksville</strong> and Montgomery<br />
County trends closely follow each other—both grew over 2.5% over the past five years, or at an<br />
annual rate of 0.5% (see Table 5).<br />
TABLE 5: Labor Force Trends, 2011-2016<br />
LABOR FORCE<br />
COMPOUND<br />
ANNUAL<br />
GROWTH RATE<br />
STRAIGHT<br />
GROWTH RATE<br />
2011 2016 (2011-2016)<br />
<strong>Clarksville</strong> 57,584 59,075 0.5% 2.6%<br />
Montgomery County 77,267 79,415 0.5% 2.8%<br />
10-county 216,422 215,998 0.0% -0.2%<br />
Source: Emsi Dataset 2017.3 using U.S. Bureau of Labor Statistics, LAUS program<br />
Six of the ten counties experienced declines. Labor force growth in the greater 10-county region<br />
was flat. Montgomery County showed the strongest labor force growth of the 10 counties, adding<br />
over 2,100 people to its available labor force over the past five years.<br />
A slowing growth in the labor force is a trend confronting employers across the country.<br />
Labor Force 19