Clarksville- Main File

Create successful ePaper yourself
Turn your PDF publications into a flip-book with our unique Google optimized e-Paper software.
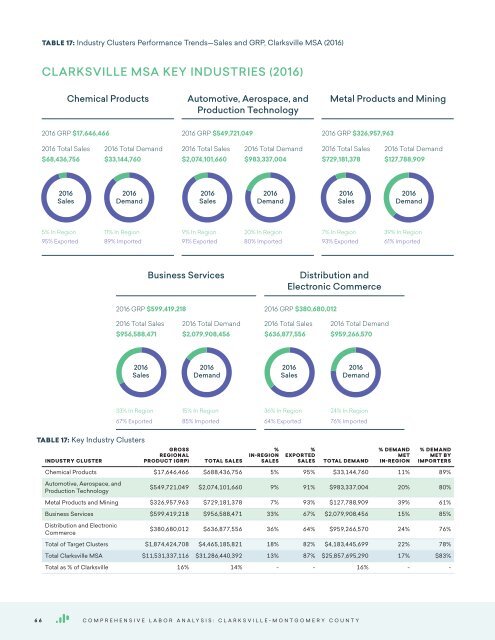
TABLE 17: Industry Clusters Performance Trends—Sales and GRP, <strong>Clarksville</strong> MSA (2016)<br />
CLARKSVILLE MSA KEY INDUSTRIES (2016)<br />
Chemical Products<br />
Automotive, Aerospace, and<br />
Production Technology<br />
Metal Products and Mining<br />
2016 GRP $17,646,466<br />
2016 GRP $549,721,049<br />
2016 GRP $326,957,963<br />
2016 Total Sales<br />
$68,436,756<br />
2016 Total Demand<br />
$33,144,760<br />
2016 Total Sales<br />
$2,074,101,660<br />
2016 Total Demand<br />
$983,337,004<br />
2016 Total Sales<br />
$729,181,378<br />
2016 Total Demand<br />
$127,788,909<br />
5% In Region<br />
95% Exported<br />
95+5O89+11O<br />
2016<br />
Sales<br />
2016<br />
Demand<br />
11% In Region<br />
89% Imported<br />
91+9O80+20O<br />
2016<br />
Sales<br />
2016<br />
Demand<br />
9% In Region<br />
91% Exported<br />
20% In Region<br />
80% Imported<br />
93+7O61+39O<br />
2016<br />
Sales<br />
2016<br />
Demand<br />
7% In Region<br />
93% Exported<br />
39% In Region<br />
61% Imported<br />
Business Services<br />
Distribution and<br />
Electronic Commerce<br />
2016 GRP $599,419,218<br />
2016 GRP $380,680,012<br />
2016 Total Sales<br />
$956,588,471<br />
2016 Total Demand<br />
$2,079,908,456<br />
2016 Total Sales<br />
$636,877,556<br />
2016 Total Demand<br />
$959,266,570<br />
67+33O85+15O<br />
2016<br />
Sales<br />
2016<br />
Demand<br />
33% In Region<br />
15% In Region<br />
64+36O 76+24O<br />
2016<br />
Sales<br />
2016<br />
Demand<br />
36% In Region<br />
24% In Region<br />
67% Exported<br />
85% Imported<br />
64% Exported<br />
76% Imported<br />
TABLE 17: Key Industry Clusters<br />
INDUSTRY CLUSTER<br />
GROSS<br />
REGIONAL<br />
PRODUCT (GRP)<br />
TOTAL SALES<br />
%<br />
IN-REGION<br />
SALES<br />
%<br />
EXPORTED<br />
SALES<br />
TOTAL DEMAND<br />
% DEMAND<br />
MET<br />
IN-REGION<br />
% DEMAND<br />
MET BY<br />
IMPORTERS<br />
Chemical Products $17,646,466 $688,436,756 5% 95% $33,144,760 11% 89%<br />
Automotive, Aerospace, and<br />
Production Technology<br />
$549,721,049 $2,074,101,660 9% 91% $983,337,004 20% 80%<br />
Metal Products and Mining $326,957,963 $729,181,378 7% 93% $127,788,909 39% 61%<br />
Business Services $599,419,218 $956,588,471 33% 67% $2,079,908,456 15% 85%<br />
Distribution and Electronic<br />
Commerce<br />
$380,680,012 $636,877,556 36% 64% $959,266,570 24% 76%<br />
Total of Target Clusters $1,874,424,708 $4,465,185,821 18% 82% $4,183,445,699 22% 78%<br />
Total <strong>Clarksville</strong> MSA $11,531,337,116 $31,286,440,392 13% 87% $25,857,695,290 17% $83%<br />
Total as % of <strong>Clarksville</strong> 16% 14% - - 16% - -<br />
66<br />
COMPREHENSIVE LABOR ANALYSIS: CLARKSVILLE-MONTGOMERY COUNTY