Clarksville- Main File

You also want an ePaper? Increase the reach of your titles
YUMPU automatically turns print PDFs into web optimized ePapers that Google loves.
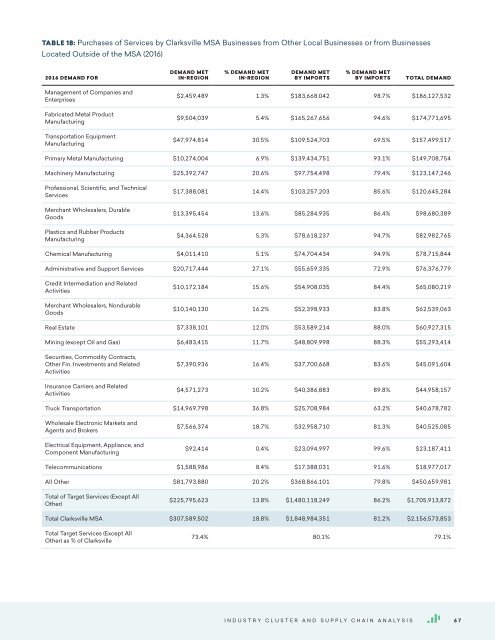
TABLE 18: Purchases of Services by <strong>Clarksville</strong> MSA Businesses from Other Local Businesses or from Businesses<br />
Located Outside of the MSA (2016)<br />
2016 DEMAND FOR<br />
DEMAND MET<br />
IN-REGION<br />
% DEMAND MET<br />
IN-REGION<br />
DEMAND MET<br />
BY IMPORTS<br />
% DEMAND MET<br />
BY IMPORTS<br />
TOTAL DEMAND<br />
Management of Companies and<br />
Enterprises<br />
Fabricated Metal Product<br />
Manufacturing<br />
Transportation Equipment<br />
Manufacturing<br />
$2,459,489 1.3% $183,668,042 98.7% $186,127,532<br />
$9,504,039 5.4% $165,267,656 94.6% $174,771,695<br />
$47,974,814 30.5% $109,524,703 69.5% $157,499,517<br />
Primary Metal Manufacturing $10,274,004 6.9% $139,434,751 93.1% $149,708,754<br />
Machinery Manufacturing $25,392,747 20.6% $97,754,498 79.4% $123,147,246<br />
Professional, Scientific, and Technical<br />
Services<br />
Merchant Wholesalers, Durable<br />
Goods<br />
Plastics and Rubber Products<br />
Manufacturing<br />
$17,388,081 14.4% $103,257,203 85.6% $120,645,284<br />
$13,395,454 13.6% $85,284,935 86.4% $98,680,389<br />
$4,364,528 5.3% $78,618,237 94.7% $82,982,765<br />
Chemical Manufacturing $4,011,410 5.1% $74,704,434 94.9% $78,715,844<br />
Administrative and Support Services $20,717,444 27.1% $55,659,335 72.9% $76,376,779<br />
Credit Intermediation and Related<br />
Activities<br />
Merchant Wholesalers, Nondurable<br />
Goods<br />
$10,172,184 15.6% $54,908,035 84.4% $65,080,219<br />
$10,140,130 16.2% $52,398,933 83.8% $62,539,063<br />
Real Estate $7,338,101 12.0% $53,589,214 88.0% $60,927,315<br />
Mining (except Oil and Gas) $6,483,415 11.7% $48,809,998 88.3% $55,293,414<br />
Securities, Commodity Contracts,<br />
Other Fin. Investments and Related<br />
Activities<br />
Insurance Carriers and Related<br />
Activities<br />
$7,390,936 16.4% $37,700,668 83.6% $45,091,604<br />
$4,571,273 10.2% $40,386,883 89.8% $44,958,157<br />
Truck Transportation $14,969,798 36.8% $25,708,984 63.2% $40,678,782<br />
Wholesale Electronic Markets and<br />
Agents and Brokers<br />
Electrical Equipment, Appliance, and<br />
Component Manufacturing<br />
$7,566,374 18.7% $32,958,710 81.3% $40,525,085<br />
$92,414 0.4% $23,094,997 99.6% $23,187,411<br />
Telecommunications $1,588,986 8.4% $17,388,031 91.6% $18,977,017<br />
All Other $81,793,880 20.2% $368,866,101 79.8% $450,659,981<br />
Total of Target Services (Except All<br />
Other)<br />
$225,795,623 13.8% $1,480,118,249 86.2% $1,705,913,872<br />
Total <strong>Clarksville</strong> MSA $307,589,502 18.8% $1,848,984,351 81.2% $2,156,573,853<br />
Total Target Services (Except All<br />
Other) as % of <strong>Clarksville</strong><br />
73.4% 80.1% 79.1%<br />
Industry Cluster and Supply Chain Analysis 67