Cardinia Shire Council - Annual Report 2017-18

Create successful ePaper yourself
Turn your PDF publications into a flip-book with our unique Google optimized e-Paper software.
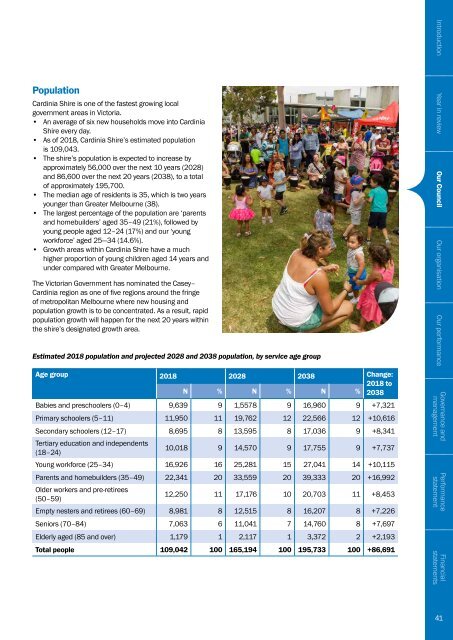
Population<br />
<strong>Cardinia</strong> <strong>Shire</strong> is one of the fastest growing local<br />
government areas in Victoria.<br />
• An average of six new households move into <strong>Cardinia</strong><br />
<strong>Shire</strong> every day.<br />
• As of 20<strong>18</strong>, <strong>Cardinia</strong> <strong>Shire</strong>’s estimated population<br />
is 109,043.<br />
• The shire’s population is expected to increase by<br />
approximately 56,000 over the next 10 years (2028)<br />
and 86,600 over the next 20 years (2038), to a total<br />
of approximately 195,700.<br />
• The median age of residents is 35, which is two years<br />
younger than Greater Melbourne (38).<br />
• The largest percentage of the population are ‘parents<br />
and homebuilders’ aged 35–49 (21%), followed by<br />
young people aged 12–24 (17%) and our ‘young<br />
workforce’ aged 25—34 (14.6%).<br />
• Growth areas within <strong>Cardinia</strong> <strong>Shire</strong> have a much<br />
higher proportion of young children aged 14 years and<br />
under compared with Greater Melbourne.<br />
The Victorian Government has nominated the Casey–<br />
<strong>Cardinia</strong> region as one of five regions around the fringe<br />
of metropolitan Melbourne where new housing and<br />
population growth is to be concentrated. As a result, rapid<br />
population growth will happen for the next 20 years within<br />
the shire’s designated growth area.<br />
Estimated 20<strong>18</strong> population and projected 2028 and 2038 population, by service age group<br />
Age group 20<strong>18</strong> 2028 2038 Change:<br />
20<strong>18</strong> to<br />
N % N % N % 2038<br />
Babies and preschoolers (0–4) 9,639 9 1,5578 9 16,960 9 +7,321<br />
Primary schoolers (5–11) 11,950 11 19,762 12 22,566 12 +10,616<br />
Secondary schoolers (12–17) 8,695 8 13,595 8 17,036 9 +8,341<br />
Tertiary education and independents<br />
(<strong>18</strong>–24)<br />
10,0<strong>18</strong> 9 14,570 9 17,755 9 +7,737<br />
Young workforce (25–34) 16,926 16 25,281 15 27,041 14 +10,115<br />
Parents and homebuilders (35–49) 22,341 20 33,559 20 39,333 20 +16,992<br />
Older workers and pre-retirees<br />
(50–59)<br />
12,250 11 17,176 10 20,703 11 +8,453<br />
Empty nesters and retirees (60–69) 8,981 8 12,515 8 16,207 8 +7,226<br />
Seniors (70–84) 7,063 6 11,041 7 14,760 8 +7,697<br />
Elderly aged (85 and over) 1,179 1 2,117 1 3,372 2 +2,193<br />
Total people 109,042 100 165,194 100 195,733 100 +86,691<br />
Introduction Year in review Our <strong>Council</strong> Our organisation Our performance<br />
Governance and<br />
management<br />
Performance<br />
statement<br />
Financial<br />
statements<br />
41