part a: strategic overview - Department of Education
part a: strategic overview - Department of Education
part a: strategic overview - Department of Education
Create successful ePaper yourself
Turn your PDF publications into a flip-book with our unique Google optimized e-Paper software.
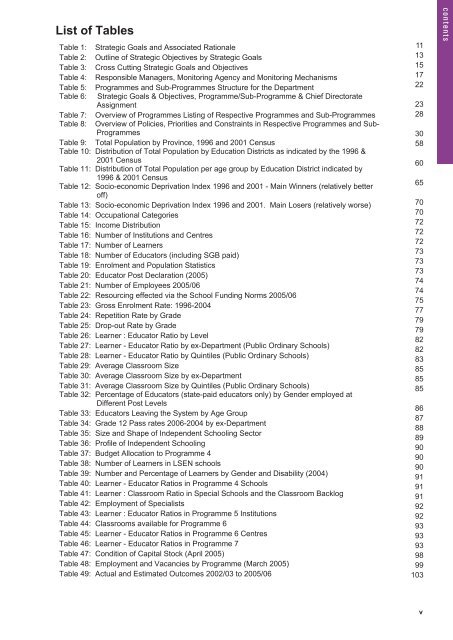
List <strong>of</strong> Tables<br />
Table 1: Strategic Goals and Associated Rationale 11<br />
Table 2: Outline <strong>of</strong> Strategic Objectives by Strategic Goals 12<br />
Table 3: Cross Cutting Strategic Goals and Objectives 15<br />
Table 4: Responsible Managers, Monitoring Agency and Monitoring Mechanisms 17<br />
Table 5: Programmes and Sub-Programmes Structure for the De<strong>part</strong>ment 38<br />
Table 6: Strategic Goals & Objectives, Programme/Sub-Programme & Chief Directorate<br />
Assignment 32<br />
Table 7: Overview <strong>of</strong> Programmes Listing <strong>of</strong> Respective Programmes and Sub-Programmes 44<br />
Table 8: Overview <strong>of</strong> Policies, Priorities and Constraints in Respective Programmes and Sub-<br />
Programmes 48<br />
Table 9: Total Population by Province, 1996 and 2001 Census 171<br />
Table 10: Distribution <strong>of</strong> Total Population by <strong>Education</strong> Districts as indicated by the 1996 &<br />
2001 Census 174<br />
Table 11: Distribution <strong>of</strong> Total Population per age group by <strong>Education</strong> District indicated by<br />
1996 & 2001 Census 181<br />
Table 12: Socio-economic Deprivation Index 1996 and 2001 - Main Winners (relatively better<br />
<strong>of</strong>f) 188<br />
Table 13: Socio-economic Deprivation Index 1996 and 2001. Main Losers (relatively worse) 188<br />
Table 14: Occupational Categories 192<br />
Table 15: Income Distribution 192<br />
Table 16: Number <strong>of</strong> Institutions and Centres 193<br />
Table 17: Number <strong>of</strong> Learners 193<br />
Table 18: Number <strong>of</strong> Educators (including SGB paid) 195<br />
Table 19: Enrolment and Population Statistics 195<br />
Table 20: Educator Post Declaration (2005) 196<br />
Table 21: Number <strong>of</strong> Employees 2005/06 197<br />
Table 22: Resourcing effected via the School Funding Norms 2005/06 198<br />
Table 23: Gross Enrolment Rate: 1996-2004 203<br />
Table 24: Repetition Rate by Grade 205<br />
Table 25: Drop-out Rate by Grade 206<br />
Table 26: Learner : Educator Ratio by Level 210<br />
Table 27: Learner - Educator Ratio by ex-De<strong>part</strong>ment (Public Ordinary Schools) 210<br />
Table 28: Learner - Educator Ratio by Quintiles (Public Ordinary Schools) 210<br />
Table 29: Average Classroom Size 214<br />
Table 30: Average Classroom Size by ex-De<strong>part</strong>ment 214<br />
Table 31: Average Classroom Size by Quintiles (Public Ordinary Schools) 214<br />
Table 32: Percentage <strong>of</strong> Educators (state-paid educators only) by Gender employed at<br />
Different Post Levels 216<br />
Table 33: Educators Leaving the System by Age Group 216<br />
Table 34: Grade 12 Pass rates 2006-2004 by ex-De<strong>part</strong>ment 219<br />
Table 35: Size and Shape <strong>of</strong> Independent Schooling Sector 220<br />
Table 36: Pr<strong>of</strong>ile <strong>of</strong> Independent Schooling 221<br />
Table 37: Budget Allocation to Programme 4 221<br />
Table 38: Number <strong>of</strong> Learners in LSEN schools 222<br />
Table 39: Number and Percentage <strong>of</strong> Learners by Gender and Disability (2004) 222<br />
Table 40: Learner - Educator Ratios in Programme 4 Schools 223<br />
Table 41: Learner : Classroom Ratio in Special Schools and the Classroom Backlog 223<br />
Table 42: Employment <strong>of</strong> Specialists 223<br />
Table 43: Learner : Educator Ratios in Programme 5 Institutions 224<br />
Table 44: Classrooms available for Programme 6 225<br />
Table 45: Learner - Educator Ratios in Programme 6 Centres 225<br />
Table 46: Learner - Educator Ratios in Programme 7 226<br />
Table 47: Condition <strong>of</strong> Capital Stock (April 2005) 241<br />
Table 48: Employment and Vacancies by Programme (March 2005) 247<br />
Table 49: Actual and Estimated Outcomes 2002/03 to 2005/06 253<br />
11<br />
13<br />
15<br />
17<br />
22<br />
23<br />
28<br />
30<br />
58<br />
60<br />
65<br />
70<br />
70<br />
72<br />
72<br />
72<br />
73<br />
73<br />
73<br />
74<br />
74<br />
75<br />
77<br />
79<br />
79<br />
82<br />
82<br />
83<br />
85<br />
85<br />
85<br />
86<br />
87<br />
88<br />
89<br />
90<br />
90<br />
90<br />
91<br />
91<br />
91<br />
92<br />
92<br />
93<br />
93<br />
93<br />
98<br />
99<br />
103<br />
iii<br />
v<br />
contents


