part a: strategic overview - Department of Education
part a: strategic overview - Department of Education
part a: strategic overview - Department of Education
Create successful ePaper yourself
Turn your PDF publications into a flip-book with our unique Google optimized e-Paper software.
Map 4: Learner : Educator Ration per District 2004<br />
13.9.6 Average Classroom Size<br />
The average classroom size has reached 40.23:1 in 2005.<br />
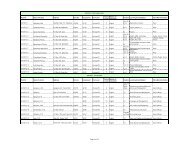
As indicated in Table 29 the average classroom size has gradually decreased from 2000<br />
to 2004 for combined schools from a high <strong>of</strong> 48.21 in 2000 to 45.86 in 2004. The LCR for<br />
secondary schools have shown a gradual decrease from 37.33 in 2000 to 35.70 in 2004.<br />
For public primary schools the classroom size has increased slightly from 33.91 to 33.15<br />
in 2004. For all public schools the classroom size decreased from 40.69 in 2000 to 39.15<br />
in 2004. The LCR was at its lowest in 2001 at 38.86. The marginal increase in LCR for<br />
Ordinary schools can be attributed to the increasing number <strong>of</strong> grade R learners that are<br />
being attached to primary schools. In 2004 alone the number has increased by around<br />
8%. As more schools are attaching grade R classes to their schools, the rate should<br />
gradually increase over the next few years.<br />
The LCR in the poorest schools have not changed dramatically since 2001. In 2004 it is<br />
still at the same level as in 2001, although it has shown signs <strong>of</strong> decrease in the 2002 –<br />
2003 period. In quintile 5, the least poor quintile, the LCR has increased from 27.76 to<br />
31.56.<br />
There may be instances where principals may not teach the required number <strong>of</strong> hours<br />
and thus reducing the number <strong>of</strong> class units. Principals are counted in the post<br />
distribution to schools. When they do not <strong>of</strong>fer time in class, the burden is re-distributed<br />
to the rest <strong>of</strong> the educator core resulting in an overload <strong>of</strong> teaching contact time for<br />
educators. This may then account for the higher classroom size. The number <strong>of</strong><br />
classrooms not in use but available, has not been included in this ratio, in order to<br />
highlight the actual average number <strong>of</strong> learners in a classroom.<br />
5 Year ECDoE Strategic Plan for 2005/06 to 2009/10. March 2006 Page 84<br />
5 Year ECDoE Strategic Plan for 2005-06 to 2009-10. 21 F (4)Page 80<br />
<strong>part</strong> C: background information


