part a: strategic overview - Department of Education
part a: strategic overview - Department of Education
part a: strategic overview - Department of Education
You also want an ePaper? Increase the reach of your titles
YUMPU automatically turns print PDFs into web optimized ePapers that Google loves.
Graph 1: Provincial Population Growth 1996-2001<br />
Eastern Cape<br />
Free State<br />
Gauteng<br />
KwaZulu-Natal<br />
Limpopo<br />
Mpumalanga<br />
North West<br />
Northern Cape<br />
Western Cape<br />
Growth % 1996 to<br />
2001<br />
-10.0% -5.0% 0.0% 5.0% 10.0% 15.0% 20.0% 25.0%<br />
There are certain difficulties associated with making comparisons between the 1996 and 2001<br />
Censuses. Prior to the release <strong>of</strong> the 2001 Census data for the Eastern Cape for example,<br />
Statistics South Africa estimated the provincial population at 6.978 million, which is<br />
considerably higher than the 2001 Census figure <strong>of</strong> 6.43 million. The Bureau <strong>of</strong> Market<br />
Research released a similar estimate <strong>of</strong> the population <strong>of</strong> the province in 2001, placing it at<br />
6.976, and stated that the original Census figure for 1996 was an undercount. Both <strong>of</strong> these<br />
estimates differ markedly from the actual 2001 Census figure released for the province which<br />
was 6.4 million - in the region <strong>of</strong> ½ million less people than previously estimated. The<br />
calculation <strong>of</strong> sub-provincial population growth estimates is thus problematic – which<br />
estimates does one use? For the purposes <strong>of</strong> this report a direct comparison will be made<br />
between the two sets <strong>of</strong> Census data and not the interim population estimates described<br />
above. This means that one is comparing two actual population censuses, notwithstanding<br />
the disputes concerning whether the figures were accurate or not.<br />
In order to derive the 1996 Census population figures for the new (post 2001) <strong>Education</strong><br />
Districts, a two-stage process was followed. Firstly, new <strong>Education</strong> District boundaries were<br />
overlain on the 18 276 Enumerator Area boundaries that existed in the 1996 Census. A code<br />
was then assigned to each enumerator area to identify the <strong>Education</strong> District that it fell within.<br />
This was then used as the basis for creating population figures for <strong>Education</strong> Districts from<br />
the 1996 Census.<br />
The 2001 figures were derived by assigning codes to the Municipalities, Wards and place<br />
names described in Table 27 that fell within each <strong>Education</strong> District.<br />
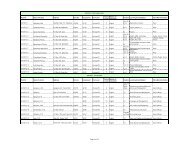
The estimated distribution <strong>of</strong> total population by education district for the period 1996 and<br />
2001 is shown in the table below<br />
5 Year ECDoE Strategic Plan for 2005/06 2005-06 to 2009/10 2009-10. March 21 F (3) 2006 Page 59 Page 55


