Level 1 Actions Part B: Level 3 Actions - Donegal County Council
Level 1 Actions Part B: Level 3 Actions - Donegal County Council
Level 1 Actions Part B: Level 3 Actions - Donegal County Council

You also want an ePaper? Increase the reach of your titles
YUMPU automatically turns print PDFs into web optimized ePapers that Google loves.
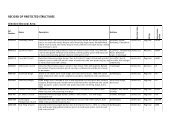
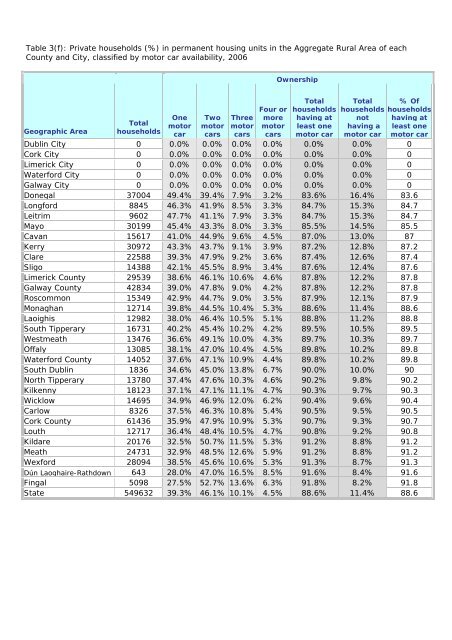
Table 3(f): Private households (%) in permanent housing units in the Aggregate Rural Area of each<br />
<strong>County</strong> and City, classified by motor car availability, 2006<br />
Geographic Area<br />
Total<br />
households<br />
One<br />
motor<br />
car<br />
Two<br />
motor<br />
cars<br />
Three<br />
motor<br />
cars<br />
Four or<br />
more<br />
motor<br />
cars<br />
Ownership<br />
Total<br />
households<br />
having at<br />
least one<br />
motor car<br />
Total<br />
households<br />
not<br />
having a<br />
motor car<br />
% Of<br />
households<br />
having at<br />
least one<br />
motor car<br />
Dublin City 0 0.0% 0.0% 0.0% 0.0% 0.0% 0.0% 0<br />
Cork City 0 0.0% 0.0% 0.0% 0.0% 0.0% 0.0% 0<br />
Limerick City 0 0.0% 0.0% 0.0% 0.0% 0.0% 0.0% 0<br />
Waterford City 0 0.0% 0.0% 0.0% 0.0% 0.0% 0.0% 0<br />
Galway City 0 0.0% 0.0% 0.0% 0.0% 0.0% 0.0% 0<br />
<strong>Donegal</strong> 37004 49.4% 39.4% 7.9% 3.2% 83.6% 16.4% 83.6<br />
Longford 8845 46.3% 41.9% 8.5% 3.3% 84.7% 15.3% 84.7<br />
Leitrim 9602 47.7% 41.1% 7.9% 3.3% 84.7% 15.3% 84.7<br />
Mayo 30199 45.4% 43.3% 8.0% 3.3% 85.5% 14.5% 85.5<br />
Cavan 15617 41.0% 44.9% 9.6% 4.5% 87.0% 13.0% 87<br />
Kerry 30972 43.3% 43.7% 9.1% 3.9% 87.2% 12.8% 87.2<br />
Clare 22588 39.3% 47.9% 9.2% 3.6% 87.4% 12.6% 87.4<br />
Sligo 14388 42.1% 45.5% 8.9% 3.4% 87.6% 12.4% 87.6<br />
Limerick <strong>County</strong> 29539 38.6% 46.1% 10.6% 4.6% 87.8% 12.2% 87.8<br />
Galway <strong>County</strong> 42834 39.0% 47.8% 9.0% 4.2% 87.8% 12.2% 87.8<br />
Roscommon 15349 42.9% 44.7% 9.0% 3.5% 87.9% 12.1% 87.9<br />
Monaghan 12714 39.8% 44.5% 10.4% 5.3% 88.6% 11.4% 88.6<br />
Laoighis 12982 38.0% 46.4% 10.5% 5.1% 88.8% 11.2% 88.8<br />
South Tipperary 16731 40.2% 45.4% 10.2% 4.2% 89.5% 10.5% 89.5<br />
Westmeath 13476 36.6% 49.1% 10.0% 4.3% 89.7% 10.3% 89.7<br />
Offaly 13085 38.1% 47.0% 10.4% 4.5% 89.8% 10.2% 89.8<br />
Waterford <strong>County</strong> 14052 37.6% 47.1% 10.9% 4.4% 89.8% 10.2% 89.8<br />
South Dublin 1836 34.6% 45.0% 13.8% 6.7% 90.0% 10.0% 90<br />
North Tipperary 13780 37.4% 47.6% 10.3% 4.6% 90.2% 9.8% 90.2<br />
Kilkenny 18123 37.1% 47.1% 11.1% 4.7% 90.3% 9.7% 90.3<br />
Wicklow 14695 34.9% 46.9% 12.0% 6.2% 90.4% 9.6% 90.4<br />
Carlow 8326 37.5% 46.3% 10.8% 5.4% 90.5% 9.5% 90.5<br />
Cork <strong>County</strong> 61436 35.9% 47.9% 10.9% 5.3% 90.7% 9.3% 90.7<br />
Louth 12717 36.4% 48.4% 10.5% 4.7% 90.8% 9.2% 90.8<br />
Kildare 20176 32.5% 50.7% 11.5% 5.3% 91.2% 8.8% 91.2<br />
Meath 24731 32.9% 48.5% 12.6% 5.9% 91.2% 8.8% 91.2<br />
Wexford 28094 38.5% 45.6% 10.6% 5.3% 91.3% 8.7% 91.3<br />
Dún Laoghaire-Rathdown 643 28.0% 47.0% 16.5% 8.5% 91.6% 8.4% 91.6<br />
Fingal 5098 27.5% 52.7% 13.6% 6.3% 91.8% 8.2% 91.8<br />
State 549632 39.3% 46.1% 10.1% 4.5% 88.6% 11.4% 88.6