- Page 2 and 3:
Clár / Agenda BORD FORBARTHA CONDA
- Page 4 and 5:
Aon Ghnó Eile / Any Other Business
- Page 6 and 7:
MIONTUAIRISCÍ CRUINNIÚ BORD FORBA
- Page 8 and 9:
Chuir an Cathaoirleach fáilte roim
- Page 10 and 11:
Dúirt In. Ní Chonluain go ndéanf
- Page 12 and 13:
Dúirt an tUas. Eoghan Ó Dughaill
- Page 14 and 15:
Thug an tUas. Ó Tonnaigh le hinse
- Page 16 and 17:
Officials in Attendance/Oifigigh ag
- Page 18 and 19:
Responding to a question from the C
- Page 20 and 21:
Mr Caoimhin MacAoidh advised that t
- Page 22 and 23:
Mr Michael Tunney advised that as p
- Page 24 and 25:
AGUISÍN 2 ATTACHMENT 2
- Page 26 and 27:
Oifigigh ag Freastal In Maria Nic F
- Page 28 and 29:
Mhol an tUas Cathal Mac Suibhne an
- Page 30 and 31: CDB 14/09 Welcome & Agenda Cllr. De
- Page 32 and 33: � Action areas included in the CD
- Page 34 and 35: DRAFT FACT SHEET NUMBER 9 - Part 2
- Page 36 and 37: Diversity of Religion in Schools Th
- Page 38 and 39: VOLUME 11: RELIGION Table 4 (a): Pe
- Page 40 and 41: Not stated 1634 Methodist 658 Other
- Page 42 and 43: Cavan Sligo Roscommon Monaghan Carl
- Page 44 and 45: Table 7(c): Population (number) cla
- Page 46 and 47: Table 8(c): Persons (number) in Cou
- Page 48 and 49: Table 9(d): Persons (%) in County D
- Page 50 and 51: accessing services and facilities.
- Page 52 and 53: Once the 49993 households in County
- Page 54 and 55: Table 1(b): Private households (%)
- Page 56 and 57: Table 2: Population Density 2006 (P
- Page 58 and 59: Table 3(b): Private households (%)
- Page 60 and 61: Table 3(e): Private households (num
- Page 62 and 63: Table 3(g): Private households (num
- Page 64 and 65: MEANS OF TRAVEL Table 4(a): Persons
- Page 66 and 67: ResidenceStudents Work aged Bus, ma
- Page 68 and 69: DISTANCE TRAVELLED Table 5(a): Tota
- Page 70 and 71: Donegal State 11832 0.3% 10.5% 20.1
- Page 72 and 73: Residence Children aged between 5 -
- Page 74 and 75: DEPARTURE TIME Table 7(a): Persons
- Page 76 and 77: Table 7(h): Students (%) aged 19 ye
- Page 78 and 79: NATURE OF OCCUPANCY Table 9(a): Pri
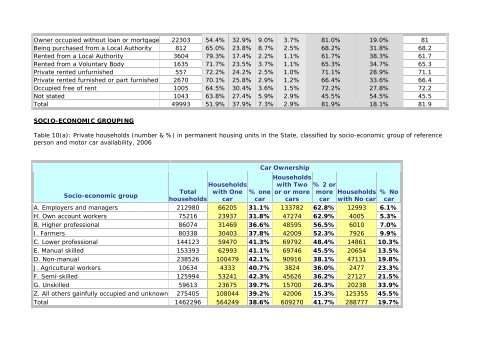
- Page 82 and 83: D. Non-manual 238526 52.5% 39.1% 6.
- Page 84 and 85: Table 10 (e) Private households in
- Page 86 and 87: AGUISÍN 4 ATTACHMENT 4
- Page 88 and 89: Sectoral Fora Tourism Forum Figure
- Page 90 and 91: CDB Sectoral Fora Details of Activi
- Page 92 and 93: CDB Working Groups Details of Activ
- Page 94 and 95: SECTION 3: Proposals for Re-alignme
- Page 96 and 97: SECTION 4: ROLES AND FUNCTIONS OF T
- Page 98 and 99: To: Each Member of the County Devel
- Page 100 and 101: 8. Undertake an audit of renewable
- Page 103 and 104: Enterprise and Skills Goal: To prom
- Page 105 and 106: Failte Ireland North West DLDC Úda
- Page 107: 8. Undertake events to promote Done
- Page 110 and 111: 8. To provide access to information
- Page 112 and 113: Údarás na Gaeltachta 6. To promot
- Page 114 and 115: Natural Resources Goal: To develop
- Page 116 and 117: Annex 1 Detailed Information Submit
- Page 118 and 119: FÁS Training Services Donegal Retr
- Page 120 and 121: policy work, the particular issues
- Page 122 and 123: continues to be involved in promoti
- Page 124 and 125: To prepare an Integrated Food devel
- Page 126 and 127: Develop and undertake up skilling p
- Page 128 and 129: To develop and implement actions to
- Page 130 and 131:
DONEGAL BRAND Goal: To develop a Do
- Page 133 and 134:
Access to Services Goal: To ensure
- Page 135 and 136:
Donegal County Council No detail pr
- Page 137 and 138:
To provide targeted initiatives for
- Page 139 and 140:
To create a central data hub of soc
- Page 141 and 142:
Further promote & develop heritage
- Page 143 and 144:
Public Art Office has commenced res
- Page 145 and 146:
Údarás na Gaeltachta No detail pr
- Page 147 and 148:
Natural Resources Goal: To develop
- Page 149 and 150:
DLDC Support for marine wildlife or
- Page 151 and 152:
Part B: Level 3 Actions Green Econo
- Page 153 and 154:
To develop a Bio-mass supply chain
- Page 155 and 156:
Undertake comprehensive retro-fit p
- Page 157 and 158:
Enterprise and Skills Goal: To prom
- Page 159 and 160:
To undertake active promotion and p
- Page 161 and 162:
To undertake research into the role
- Page 163 and 164:
To develop mechanisms to disseminat
- Page 165:
Promote and support "Donegal Brand"
- Page 168 and 169:
Identify poverty needs in the count
- Page 170 and 171:
To create a central data hub of soc
- Page 172 and 173:
Further promote & develop heritage
- Page 174 and 175:
To make business cases to support a
- Page 176 and 177:
To develop a co-ordination platform
- Page 178 and 179:
To develop the county's marine & wa
- Page 180 and 181:
Inishowen Development Partnership D
- Page 182 and 183:
AGUISÍN 6 ATTACHMENT 6 182
- Page 184 and 185:
Minutes of Children’s Services Co
- Page 186 and 187:
The CSC agreed in principle to go w
- Page 188 and 189:
Feedback from National Implementati
- Page 190 and 191:
Project Name Project Aim Partners I
- Page 192 and 193:
MINUTES OF THE CDB PEACE AND RECONC
- Page 194 and 195:
File Ref Name of Rec’s to Approve
- Page 196 and 197:
Schedule 3 - Considerations with re
- Page 198 and 199:
Score: 132 Proposed Conditions if A
- Page 200 and 201:
The Partnership Agreement as circul
- Page 202 and 203:
AGUISÍN 8 ATTACHMENT 8 202
- Page 204 and 205:
Project Name Project Aim Partners I
- Page 206 and 207:
• In ‘06, 140 households in Don
- Page 208 and 209:
c) Exploring and implementing effec
- Page 210 and 211:
• J Jackson submitted list of iss
- Page 213 and 214:
Strategic Plan Donegal CDB Interage
- Page 215 and 216:
Summary of Terms CDB County Develop
- Page 217 and 218:
1. Introduction The Report of the H
- Page 219 and 220:
• Second Progress Report of the C
- Page 221 and 222:
Raphoe 10 St. Johnston 1 Stranorlar
- Page 223 and 224:
• Education including Formal Educ
- Page 225 and 226:
3. Workshop to be delivered in Quar
- Page 227 and 228:
Strategic approach with specific ac
- Page 229 and 230:
Indicators Immediate Medium term Lo
- Page 231 and 232:
trained, target audience, venues, t
- Page 233 and 234:
DCC � � � HSE � * � �
- Page 235 and 236:
Objective 5.4.2: To work in partner
- Page 237 and 238:
Objective 5.4.3: To support young T
- Page 239 and 240:
Indicators Immediate Medium term Lo
- Page 241 and 242:
Indicators Immediate Medium term Lo
- Page 243 and 244:
Action 5.6.4 Explore opportunities
- Page 245 and 246:
Minutes of Meeting Date & Venue: 26
- Page 247 and 248:
AGUISÍN 9 ATTACHMENT 9 247
- Page 249 and 250:
AGUISÍN 10 ATTACHMENT 10 249
- Page 251 and 252:
Information updates to DONEGAL CDB
- Page 253 and 254:
Information updates to DONEGAL CDB
- Page 255 and 256:
AGUISÍN 12 ATTACHMENT 12 255
- Page 257 and 258:
County Donegal Submission for Count
- Page 259 and 260:
On any given Friday Average Kilomet
- Page 261 and 262:
AGUISÍN 13 ATTACHMENT 13 261
- Page 263 and 264:
4. What measures/actions are to be
- Page 265 and 266:
AGUISÍN 14 ATTACHMENT 14 265
- Page 267 and 268:
If you have any queries regarding t
- Page 269 and 270:
• prepare guidelines or protocols
- Page 271 and 272:
and tasks, in order to avoid duplic
- Page 273 and 274:
LG 11/09 10 June, 2009 Re: Reconsti
- Page 275:
APPENDIX I Representation from Loca
- Page 280:
Page 0 of 292
- Page 286:
Page 0 of 292
- Page 289:
Page 0 of 292