VGB POWERTECH 7 (2021) - International Journal for Generation and Storage of Electricity and Heat
VGB PowerTech - International Journal for Generation and Storage of Electricity and Heat. Issue 7 (2021). Technical Journal of the VGB PowerTech Association. Energy is us! Optimisation of power plants. Thermal waste utilisation.
VGB PowerTech - International Journal for Generation and Storage of Electricity and Heat. Issue 7 (2021).
Technical Journal of the VGB PowerTech Association. Energy is us!
Optimisation of power plants. Thermal waste utilisation.
- No tags were found...

Create successful ePaper yourself
Turn your PDF publications into a flip-book with our unique Google optimized e-Paper software.
Equipment selection methodology <strong>of</strong> seismic probability safety assessment <strong>for</strong> nuclear power plants <strong>VGB</strong> PowerTech 7 l <strong>2021</strong><br />
Tab. 5. Sensitivity analysis result <strong>for</strong> various equipment exclusion.<br />
Component Description Am βu βr HCLPF ΔCDF(%)<br />
SEIS-EP-BATT Seismic failure <strong>of</strong> station batteries 1.02 0.19 0.42 0.35 -2.25%<br />
SEIS-EE-DAY-TK Seismic failure <strong>of</strong> EDG fuel oil day tanks 1.08 0.45 0.24 0.33 -2.22%<br />
SEIS-EP-XFRMR Seismic failure <strong>of</strong> 4kv-480v trans<strong>for</strong>mers 0.83 0.24 0.25 0.37 -0.20%<br />
SEIS-BC-BCHX Seismic failure <strong>of</strong> Bearing Cooling HXs 0.77 0.25 0.22 0.35 -0.96%<br />
Although an attempt was made to review<br />
more cases <strong>of</strong> PSHA <strong>and</strong> seismic core damage<br />
frequency (SCDF), the published data<br />
are limited <strong>and</strong> insufficient to infer an accurate<br />
correlation; however, the trend can<br />
be confirmed using published data. The<br />
values that represent the correlation between<br />
site SPHA <strong>and</strong> SCDF are the probability<br />
<strong>of</strong> exceeding 1.0 g <strong>and</strong> the probability<br />
<strong>of</strong> exceeding the safety shutdown earthquake<br />
(SSE). First, the probability <strong>of</strong> seismic<br />
acceleration exceeding 1.0 g corresponds<br />
to a very large earthquake magnitude,<br />
so most power plants assume that<br />
direct core damage occurs. However, as a<br />
result <strong>of</strong> reviewing the case <strong>of</strong> power plants<br />
based on this value, it is difficult to represent<br />
the characteristics <strong>of</strong> seismic hazards<br />
based on Pr(a>1.0 g), since the core damage<br />
frequency <strong>for</strong> earthquakes exceeding<br />
Second, we examine the amount <strong>of</strong> change<br />
in CDF <strong>for</strong> equipment with similar HCLPF.<br />
Even with similar HCLPF value, the A m<br />
value may show large difference according<br />
to the β value, <strong>and</strong> the effect may be very<br />
different depending on the seismic acceleration<br />
intervals determined. In addition,<br />
the accident sequence varies depending on<br />
the plant characteristics, so the target<br />
equipment contributes to plant safety<br />
which can have a very different effect on<br />
the entire CDF. There<strong>for</strong>e, screening based<br />
on single HCLPF criteria will not be able to<br />
underst<strong>and</strong> all the effects without per<strong>for</strong>ming<br />
various sensitivity analyses <strong>and</strong><br />
may have an optimistic effect on the overall<br />
results. Ta b l e 5 shows the analysis <strong>of</strong> the<br />
effect on CDF that is reduced when four<br />
pieces <strong>of</strong> equipment with similar HCLPF<br />
(battery; emergency diesel generator fuel<br />
oil day tank; 4 kV-480 V trans<strong>for</strong>mer; <strong>and</strong><br />
bearing cooling heat exchanger) are excluded<br />
from the model.<br />
As a result, it can be seen that in the case <strong>of</strong><br />
the battery, the reduction rate <strong>of</strong> CDF is<br />
very large, corresponding to 2.25 %, but in<br />
the case <strong>of</strong> the trans<strong>for</strong>mer, it is very small,<br />
corresponding to 0.2 %. There<strong>for</strong>e, it can<br />
be seen that if a single HCLPF criterion is<br />
applied <strong>and</strong> screened-out, the effect on the<br />
entire CDF is different <strong>for</strong> each piece <strong>of</strong><br />
equipment, <strong>and</strong> thus further analysis is required.<br />
Tab. 6. Comparison <strong>of</strong> PSHA <strong>and</strong> Seismic CDF <strong>for</strong> reference plant [6, 7].<br />
Site name Pr (a>SSE) Pr (a>1.0g) Seismic CDF Seismic CDF Proportion<br />
(Over 1.0g)<br />
Seabrook 4.62E-04 3.80E-06 2.99E-05 13 %<br />
Krsko 4.00E-04 1.40E-06 5.96E-05 2 %<br />
Limerick 2.29E-04 1.79E-06 5.72E-06 31 %<br />
IP2 2.12E-04 1.75E-06 8.40E-06 21 %<br />
Millstone 3 1.82E-04 1.47E-06 8.85E-06 17 %<br />
Surry 1.32E-04 6.00E-07 2.37E-05 3 %<br />
Average 2.61E-04 1.79E-06 1.99E-05 14 %<br />
0.00010<br />
0.00008<br />
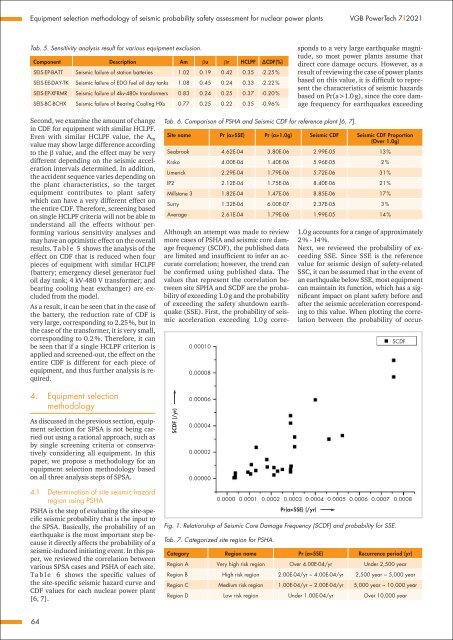
1.0 g accounts <strong>for</strong> a range <strong>of</strong> approximately<br />
2 % - 14 %.<br />
Next, we reviewed the probability <strong>of</strong> exceeding<br />
SSE. Since SSE is the reference<br />
value <strong>for</strong> seismic design <strong>of</strong> safety-related<br />
SSC, it can be assumed that in the event <strong>of</strong><br />
an earthquake below SSE, most equipment<br />
can maintain its function, which has a significant<br />
impact on plant safety be<strong>for</strong>e <strong>and</strong><br />
after the seismic acceleration corresponding<br />
to this value. When plotting the correlation<br />
between the probability <strong>of</strong> occur-<br />
SCDF<br />
4. Equipment selection<br />
methodology<br />
As discussed in the previous section, equipment<br />
selection <strong>for</strong> SPSA is not being carried<br />
out using a rational approach, such as<br />
by single screening criteria or conservatively<br />
considering all equipment. In this<br />
paper, we propose a methodology <strong>for</strong> an<br />
equipment selection methodology based<br />
on all three analysis steps <strong>of</strong> SPSA.<br />
SCDF (/yr)<br />
0.00006<br />
0.00004<br />
0.00002<br />
0.00000<br />
4.1 Determination <strong>of</strong> site seismic hazard<br />
region using PSHA<br />
PSHA is the step <strong>of</strong> evaluating the site-specific<br />
seismic probability that is the input to<br />
the SPSA. Basically, the probability <strong>of</strong> an<br />
earthquake is the most important step because<br />
it directly affects the probability <strong>of</strong> a<br />
seismic-induced initiating event. In this paper,<br />
we reviewed the correlation between<br />
various SPSA cases <strong>and</strong> PSHA <strong>of</strong> each site.<br />
Ta b l e 6 shows the specific values <strong>of</strong><br />
the site-specific seismic hazard curve <strong>and</strong><br />
CDF values <strong>for</strong> each nuclear power plant<br />
[6, 7].<br />
0.0000 0.0001 0.0002 0.0003 0.0004 0.0005 0.0006 0.0007 0.0008<br />
Pr(a>SSE) (/yr)<br />
Fig. 1. Relationship <strong>of</strong> Seismic Core Damage Frequency (SCDF) <strong>and</strong> probability <strong>for</strong> SSE.<br />
Tab. 7. Categorized site region <strong>for</strong> PSHA.<br />
Category Region name Pr (a>SSE) Recurrence period (yr)<br />
Region A Very high risk region Over 4.00E-04/yr Under 2,500 year<br />
Region B High risk region 2.00E-04/yr ~ 4.00E-04/yr 2,500 year ~ 5,000 year<br />
Region C Medium risk region 1.00E-04/yr ~ 2.00E-04/yr 5,000 year ~ 10,000 year<br />
Region D Low risk region Under 1.00E-04/yr Over 10,000 year<br />
64