VGB POWERTECH 7 (2021) - International Journal for Generation and Storage of Electricity and Heat
VGB PowerTech - International Journal for Generation and Storage of Electricity and Heat. Issue 7 (2021). Technical Journal of the VGB PowerTech Association. Energy is us! Optimisation of power plants. Thermal waste utilisation.
VGB PowerTech - International Journal for Generation and Storage of Electricity and Heat. Issue 7 (2021).
Technical Journal of the VGB PowerTech Association. Energy is us!
Optimisation of power plants. Thermal waste utilisation.
- No tags were found...

Create successful ePaper yourself
Turn your PDF publications into a flip-book with our unique Google optimized e-Paper software.
Verification <strong>of</strong> SPACE code based on an MSGTR experiment at the ATLAS-PAFS facility <strong>VGB</strong> PowerTech 7 l <strong>2021</strong><br />
Tab. 2. Sequence <strong>of</strong> transient analysis result.<br />
Event Experiment (t = t*) SPACE code (t = t*) Remarks<br />
MSGTR initiation 0.0000 0.0000<br />
<strong>of</strong> the primary system was reduced by the<br />
break, the pressure <strong>of</strong> the PZR was predicted<br />
to be lower than the experiment results<br />
(t* < 0.2 in F i g u r e 7 ). The pressure <strong>of</strong><br />
the primary system was relatively lower<br />
than that obtained in the experiment results,<br />
thus indicating a lower break flow<br />
rate. Due to the lower break flow rate, the<br />
pressure <strong>of</strong> PZR was maintained somewhat<br />
higher than the experiment result, which<br />
PZR heater <strong>of</strong>f at same time as experiment<br />
scenario<br />
HSGL signal 0.0011 0.0024 SG collapsed water level > set-point<br />
Reactor trip 0.0011 0.0024<br />
MSIV close 0.0015 0.0028<br />
MFIV close 0.0018 0.0031<br />
Coincident with HSGL<br />
Decay power start 0.0023 0.0036 Delay times after reactor trip<br />
MSSV first opening 0.0026 0.0033 SG pressure > set-point<br />
LPP signal 0.0248 0.0232 PZR pressure < set-point<br />
SIP injection start 0.0276 0.0260 Delay times after LPP signal<br />
PAFS operation start 0.7204 0.7173 SG collapsed water level < set-point<br />
resulted in the break flow rate being maintained<br />
(t* > 0.2 in F i g u r e 7 ). At the moment<br />
the break occurred, the pressure in<br />
the pressurizer began to decrease rapidly<br />
due to the loss <strong>of</strong> coolant through the break<br />
point. The depressurization rates <strong>of</strong> the<br />
pressurizer obtained from the experiment<br />
<strong>and</strong> the calculation results were almost the<br />
same, as shown in F i g u r e 7. The pressure<br />
in the pressurizer continually decreased<br />
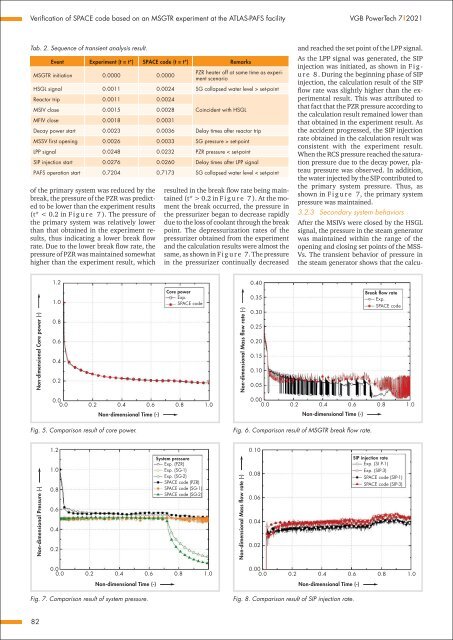
<strong>and</strong> reached the set point <strong>of</strong> the LPP signal.<br />
As the LPP signal was generated, the SIP<br />
injection was initiated, as shown in F i g -<br />
u r e 8 . During the beginning phase <strong>of</strong> SIP<br />
injection, the calculation result <strong>of</strong> the SIP<br />
flow rate was slightly higher than the experimental<br />
result. This was attributed to<br />
that fact that the PZR pressure according to<br />
the calculation result remained lower than<br />
that obtained in the experiment result. As<br />
the accident progressed, the SIP injection<br />
rate obtained in the calculation result was<br />
consistent with the experiment result.<br />
When the RCS pressure reached the saturation<br />
pressure due to the decay power, plateau<br />
pressure was observed. In addition,<br />
the water injected by the SIP contributed to<br />
the primary system pressure. Thus, as<br />
shown in F i g u r e 7, the primary system<br />
pressure was maintained.<br />
3.2.3 Secondary system behaviors<br />
After the MSIVs were closed by the HSGL<br />
signal, the pressure in the steam generator<br />
was maintained within the range <strong>of</strong> the<br />
opening <strong>and</strong> closing set points <strong>of</strong> the MSS-<br />
Vs. The transient behavior <strong>of</strong> pressure in<br />
the steam generator shows that the calcu-<br />
1.2<br />
0.40<br />
Non-dimensional Core power (-)<br />
1.0<br />
0.8<br />
0.6<br />
0.4<br />
0.2<br />
Core power<br />
Exp.<br />
SPACE code<br />
Non-dimensional Mass flow rate (-)<br />
0.35<br />
0.30<br />
0.25<br />
0.20<br />
0.15<br />
0.10<br />
0.05<br />
Break flow rate<br />
Exp.<br />
SPACE code<br />
0.0<br />
0.0 0.2 0.4 0.6 0.8 1.0<br />
Non-dimensional Time (-)<br />
Fig. 5. Comparison result <strong>of</strong> core power.<br />
0.00<br />
0.0 0.2 0.4 0.6 0.8 1.0<br />
Non-dimensional Time (-)<br />
Fig. 6. Comparison result <strong>of</strong> MSGTR break flow rate.<br />
Non-dimensional Pressure (-)<br />
1.2<br />
1.0<br />
0.8<br />
0.6<br />
0.4<br />
0.2<br />
System pressure<br />
Exp. (PZR)<br />
Exp. (SG-1)<br />
Exp. (SG-2)<br />
SPACE code (PZR)<br />
SPACE code (SG-1)<br />
SPACE code (SG-2)<br />
Non-dimensional Mass flow rate (-)<br />
0.10<br />
0.08<br />
0.06<br />
0.04<br />
0.02<br />
SIP injection rate<br />
Exp. (SI P-1)<br />
Exp. (SIP-3)<br />
SPACE code (SIP-1)<br />
SPACE code (SIP-3)<br />
0.0<br />
0.0 0.2 0.4 0.6 0.8 1.0<br />
Non-dimensional Time (-)<br />
Fig. 7. Comparison result <strong>of</strong> system pressure.<br />
0.00<br />
0.0 0.2 0.4 0.6 0.8 1.0<br />
Non-dimensional Time (-)<br />
Fig. 8. Comparison result <strong>of</strong> SIP injection rate.<br />
82