VGB POWERTECH 7 (2021) - International Journal for Generation and Storage of Electricity and Heat
VGB PowerTech - International Journal for Generation and Storage of Electricity and Heat. Issue 7 (2021). Technical Journal of the VGB PowerTech Association. Energy is us! Optimisation of power plants. Thermal waste utilisation.
VGB PowerTech - International Journal for Generation and Storage of Electricity and Heat. Issue 7 (2021).
Technical Journal of the VGB PowerTech Association. Energy is us!
Optimisation of power plants. Thermal waste utilisation.
- No tags were found...

Create successful ePaper yourself
Turn your PDF publications into a flip-book with our unique Google optimized e-Paper software.
<strong>VGB</strong> PowerTech 7 l <strong>2021</strong><br />
Verification <strong>of</strong> SPACE code based on an MSGTR experiment at the ATLAS-PAFS facility<br />
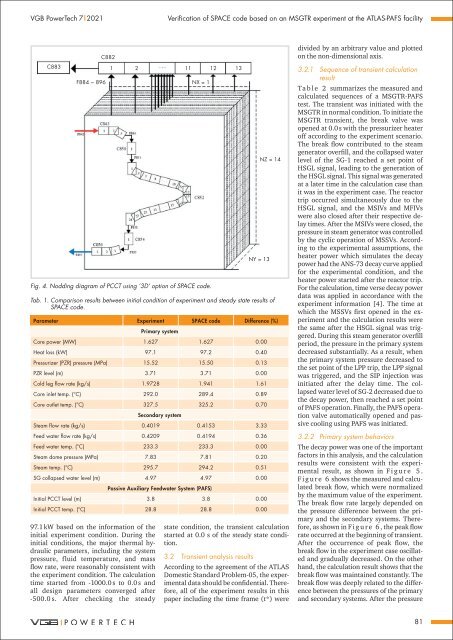
C883<br />
F884 ~ 896<br />
C882<br />
97.1 kW based on the in<strong>for</strong>mation <strong>of</strong> the<br />
initial experiment condition. During the<br />
initial conditions, the major thermal hydraulic<br />
parameters, including the system<br />
pressure, fluid temperature, <strong>and</strong> mass<br />
flow rate, were reasonably consistent with<br />
the experiment condition. The calculation<br />
time started from -1000.0 s to 0.0 s <strong>and</strong><br />
all design parameters converged after<br />
-500.0 s. After checking the steady<br />
1 2 11 12 13<br />
NX = 1<br />
Fig. 4. Nodding diagram <strong>of</strong> PCCT using ‘3D’ option <strong>of</strong> SPACE code.<br />
NY = 13<br />
NZ = 14<br />
Tab. 1. Comparison results between initial condition <strong>of</strong> experiment <strong>and</strong> steady state results <strong>of</strong><br />
SPACE code.<br />
Parameter Experiment SPACE code Difference (%)<br />
Primary system<br />
Core power (MW) 1.627 1.627 0.00<br />
<strong>Heat</strong> loss (kW) 97.1 97.2 0.40<br />
Pressurizer (PZR) pressure (MPa) 15.52 15.50 0.13<br />
PZR level (m) 3.71 3.71 0.00<br />
Cold leg flow rate (kg/s) 1.9728 1.941 1.61<br />
Core inlet temp. (°C) 292.0 289.4 0.89<br />
Core outlet temp. (°C) 327.5 325.2 0.70<br />
Secondary system<br />
Steam flow rate (kg/s) 0.4019 0.4153 3.33<br />
Feed water flow rate (kg/s) 0.4209 0.4194 0.36<br />
Feed water temp. (°C) 233.3 233.3 0.00<br />
Steam dome pressure (MPa) 7.83 7.81 0.20<br />
Steam temp. (°C) 295.7 294.2 0.51<br />
SG collapsed water level (m) 4.97 4.97 0.00<br />
Passive Auxiliary Feedwater System (PAFS)<br />
Initial PCCT level (m) 3.8 3.8 0.00<br />
Initial PCCT temp. (°C) 28.8 28.8 0.00<br />
state condition, the transient calculation<br />
started at 0.0 s <strong>of</strong> the steady state condition.<br />
3.2 Transient analysis results<br />
According to the agreement <strong>of</strong> the ATLAS<br />
Domestic St<strong>and</strong>ard Problem-05, the experimental<br />
data should be confidential. There<strong>for</strong>e,<br />
all <strong>of</strong> the experiment results in this<br />
paper including the time frame (t*) were<br />
divided by an arbitrary value <strong>and</strong> plotted<br />
on the non-dimensional axis.<br />
3.2.1 Sequence <strong>of</strong> transient calculation<br />
result<br />
Ta b l e 2 summarizes the measured <strong>and</strong><br />
calculated sequences <strong>of</strong> a MSGTR-PAFS<br />
test. The transient was initiated with the<br />
MSGTR in normal condition. To initiate the<br />
MSGTR transient, the break valve was<br />
opened at 0.0 s with the pressurizer heater<br />
<strong>of</strong>f according to the experiment scenario.<br />
The break flow contributed to the steam<br />
generator overfill, <strong>and</strong> the collapsed water<br />
level <strong>of</strong> the SG-1 reached a set point <strong>of</strong><br />
HSGL signal, leading to the generation <strong>of</strong><br />
the HSGL signal. This signal was generated<br />
at a later time in the calculation case than<br />
it was in the experiment case. The reactor<br />
trip occurred simultaneously due to the<br />
HSGL signal, <strong>and</strong> the MSIVs <strong>and</strong> MFIVs<br />
were also closed after their respective delay<br />
times. After the MSIVs were closed, the<br />
pressure in steam generator was controlled<br />
by the cyclic operation <strong>of</strong> MSSVs. According<br />
to the experimental assumptions, the<br />
heater power which simulates the decay<br />
power had the ANS-73 decay curve applied<br />
<strong>for</strong> the experimental condition, <strong>and</strong> the<br />
heater power started after the reactor trip.<br />
For the calculation, time verse decay power<br />
data was applied in accordance with the<br />
experiment in<strong>for</strong>mation [4]. The time at<br />
which the MSSVs first opened in the experiment<br />
<strong>and</strong> the calculation results were<br />
the same after the HSGL signal was triggered.<br />
During this steam generator overfill<br />
period, the pressure in the primary system<br />
decreased substantially. As a result, when<br />
the primary system pressure decreased to<br />
the set point <strong>of</strong> the LPP trip, the LPP signal<br />
was triggered, <strong>and</strong> the SIP injection was<br />
initiated after the delay time. The collapsed<br />
water level <strong>of</strong> SG-2 decreased due to<br />
the decay power, then reached a set point<br />
<strong>of</strong> PAFS operation. Finally, the PAFS operation<br />
valve automatically opened <strong>and</strong> passive<br />
cooling using PAFS was initiated.<br />
3.2.2 Primary system behaviors<br />
The decay power was one <strong>of</strong> the important<br />
factors in this analysis, <strong>and</strong> the calculation<br />
results were consistent with the experimental<br />
result, as shown in F i g u r e 5 .<br />
F i g u r e 6 shows the measured <strong>and</strong> calculated<br />
break flow, which were normalized<br />
by the maximum value <strong>of</strong> the experiment.<br />
The break flow rate largely depended on<br />
the pressure difference between the primary<br />
<strong>and</strong> the secondary systems. There<strong>for</strong>e,<br />
as shown in F i g u r e 6 , the peak flow<br />
rate occurred at the beginning <strong>of</strong> transient.<br />
After the occurrence <strong>of</strong> peak flow, the<br />
break flow in the experiment case oscillated<br />
<strong>and</strong> gradually decreased. On the other<br />
h<strong>and</strong>, the calculation result shows that the<br />
break flow was maintained constantly. The<br />
break flow was deeply related to the difference<br />
between the pressures <strong>of</strong> the primary<br />
<strong>and</strong> secondary systems. After the pressure<br />
81