VGB POWERTECH 7 (2021) - International Journal for Generation and Storage of Electricity and Heat
VGB PowerTech - International Journal for Generation and Storage of Electricity and Heat. Issue 7 (2021). Technical Journal of the VGB PowerTech Association. Energy is us! Optimisation of power plants. Thermal waste utilisation.
VGB PowerTech - International Journal for Generation and Storage of Electricity and Heat. Issue 7 (2021).
Technical Journal of the VGB PowerTech Association. Energy is us!
Optimisation of power plants. Thermal waste utilisation.
- No tags were found...

Create successful ePaper yourself
Turn your PDF publications into a flip-book with our unique Google optimized e-Paper software.
<strong>VGB</strong> PowerTech 7 l <strong>2021</strong><br />
Continuation <strong>of</strong> table 8 on the next page<br />
rence <strong>of</strong> SSE <strong>and</strong> CDF, it can be seen that<br />
the correlation between the two variables<br />
is high, as shown in F i g u r e 1 .<br />
There<strong>for</strong>e, if this value is broadly divided<br />
into four types, as shown in Ta b l e 7, it is<br />
possible to classify the possibility <strong>of</strong> earthquake<br />
occurrence on the site by reoccurrence<br />
period.<br />
In the methodology proposed in this paper,<br />
the probability <strong>of</strong> SSE occurrence is basically<br />
divided into four major sections, <strong>and</strong><br />
we intend to use this as the basis <strong>for</strong> determining<br />
the equipment groups that need to<br />
be subjected to fragility analysis. In the<br />
case <strong>of</strong> Region A, since earthquakes are<br />
very likely to occur, it is suggested that the<br />
number <strong>of</strong> equipment groups that need to<br />
be analyzed <strong>for</strong> fragility is most; <strong>and</strong> in the<br />
case <strong>of</strong> Region D, the equipment target <strong>for</strong><br />
fragility analysis is least because <strong>of</strong> the lowest<br />
probability <strong>of</strong> earthquakes. To examine<br />
the adequacy <strong>of</strong> the four distinct values,<br />
the data on the seismic hazard values <strong>of</strong><br />
power plants operating in the US [8] are<br />
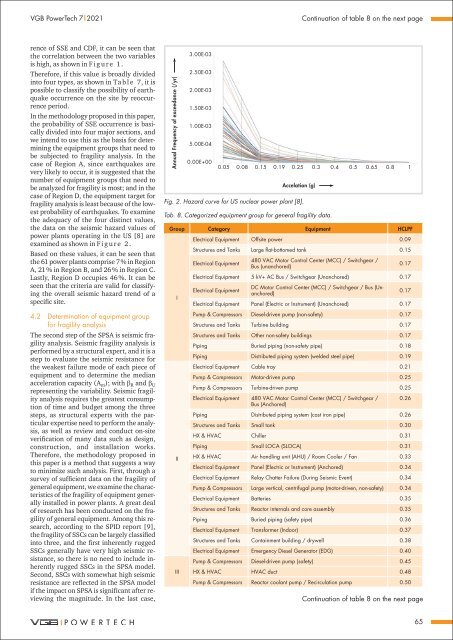
examined as shown in F i g u r e 2 .<br />
Based on these values, it can be seen that<br />
the 61 power plants comprise 7 % in Region<br />
A, 21 % in Region B, <strong>and</strong> 26 % in Region C.<br />
Lastly, Region D occupies 46 %. It can be<br />
seen that the criteria are valid <strong>for</strong> classifying<br />
the overall seismic hazard trend <strong>of</strong> a<br />
specific site.<br />
Annual Frequency <strong>of</strong> exceedance (/yr)<br />
3.00E-03<br />
2.50E-03<br />
2.00E-03<br />
1.50E-03<br />
1.00E-03<br />
5.00E-04<br />
0.00E+00<br />
0.05 0.08 0.15 0.19 0.25 0.3 0.4 0.5 0.65 0.8 1<br />
Accelation (g)<br />
Fig. 2. Hazard curve <strong>for</strong> US nuclear power plant [8].<br />
Tab. 8. Categorized equipment group <strong>for</strong> general fragility data.<br />
Group Category Equipment HCLPF<br />
I<br />
Electrical Equipment Offsite power 0.09<br />
Structures <strong>and</strong> Tanks Large flat-bottomed tank 0.15<br />
Electrical Equipment<br />
480 VAC Motor Control Center (MCC) / Switchgear /<br />
Bus (unanchored)<br />
0.17<br />
Electrical Equipment 5 kV+ AC Bus / Switchgear (Unanchored) 0.17<br />
Electrical Equipment<br />
DC Motor Control Center (MCC) / Switchgear / Bus (Unanchored)<br />
0.17<br />
Electrical Equipment Panel (Electric or Instrument) (Unanchored) 0.17<br />
4.2 Determination <strong>of</strong> equipment group<br />
<strong>for</strong> fragility analysis<br />
The second step <strong>of</strong> the SPSA is seismic fragility<br />
analysis. Seismic fragility analysis is<br />
per<strong>for</strong>med by a structural expert, <strong>and</strong> it is a<br />
step to evaluate the seismic resistance <strong>for</strong><br />
the weakest failure mode <strong>of</strong> each piece <strong>of</strong><br />
equipment <strong>and</strong> to determine the median<br />
acceleration capacity (A m ); with β R <strong>and</strong> β U<br />
representing the variability. Seismic fragility<br />
analysis requires the greatest consumption<br />
<strong>of</strong> time <strong>and</strong> budget among the three<br />
steps, as structural experts with the particular<br />
expertise need to per<strong>for</strong>m the analysis,<br />
as well as review <strong>and</strong> conduct on-site<br />
verification <strong>of</strong> many data such as design,<br />
construction, <strong>and</strong> installation works.<br />
There<strong>for</strong>e, the methodology proposed in<br />
this paper is a method that suggests a way<br />
to minimize such analysis. First, through a<br />
survey <strong>of</strong> sufficient data on the fragility <strong>of</strong><br />
general equipment, we examine the characteristics<br />
<strong>of</strong> the fragility <strong>of</strong> equipment generally<br />
installed in power plants. A great deal<br />
<strong>of</strong> research has been conducted on the fragility<br />
<strong>of</strong> general equipment. Among this research,<br />
according to the SPID report [9],<br />
the fragility <strong>of</strong> SSCs can be largely classified<br />
into three, <strong>and</strong> the first inherently rugged<br />
SSCs generally have very high seismic resistance,<br />
so there is no need to include inherently<br />
rugged SSCs in the SPSA model.<br />
Second, SSCs with somewhat high seismic<br />
resistance are reflected in the SPSA model<br />
if the impact on SPSA is significant after reviewing<br />
the magnitude. In the last case,<br />
II<br />
III<br />
Pump & Compressors Diesel-driven pump (non-safety) 0.17<br />
Structures <strong>and</strong> Tanks Turbine building 0.17<br />
Structures <strong>and</strong> Tanks Other non-safety buildings 0.17<br />
Piping Buried piping (non-safety pipe) 0.18<br />
Piping Distributed piping system (welded steel pipe) 0.19<br />
Electrical Equipment Cable tray 0.21<br />
Pump & Compressors Motor-driven pump 0.25<br />
Pump & Compressors Turbine-driven pump 0.25<br />
Electrical Equipment 480 VAC Motor Control Center (MCC) / Switchgear /<br />
Bus (Anchored)<br />
0.26<br />
Piping Distributed piping system (cast iron pipe) 0.26<br />
Structures <strong>and</strong> Tanks Small tank 0.30<br />
HX & HVAC Chiller 0.31<br />
Piping Small LOCA (SLOCA) 0.31<br />
HX & HVAC Air h<strong>and</strong>ling unit (AHU) / Room Cooler / Fan 0.33<br />
Electrical Equipment Panel (Electric or Instrument) (Anchored) 0.34<br />
Electrical Equipment Relay Chatter Failure (During Seismic Event) 0.34<br />
Pump & Compressors Large vertical, centrifugal pump (motor-driven, non-safety) 0.34<br />
Electrical Equipment Batteries 0.35<br />
Structures <strong>and</strong> Tanks Reactor internals <strong>and</strong> core assembly 0.35<br />
Piping Buried piping (safety pipe) 0.36<br />
Electrical Equipment Trans<strong>for</strong>mer (Indoor) 0.37<br />
Structures <strong>and</strong> Tanks Containment building / drywell 0.38<br />
Electrical Equipment Emergency Diesel Generator (EDG) 0.40<br />
Pump & Compressors Diesel-driven pump (safety) 0.45<br />
HX & HVAC HVAC duct 0.48<br />
Pump & Compressors Reactor coolant pump / Recirculation pump 0.50<br />
Continuation <strong>of</strong> table 8 on the next page<br />
65