SECURITAS AB Annual Report 2011
SECURITAS AB Annual Report 2011
SECURITAS AB Annual Report 2011

You also want an ePaper? Increase the reach of your titles
YUMPU automatically turns print PDFs into web optimized ePapers that Google loves.
124<br />
<strong>Annual</strong> <strong>Report</strong><br />
Notes and comments to the consolidated financial statements<br />
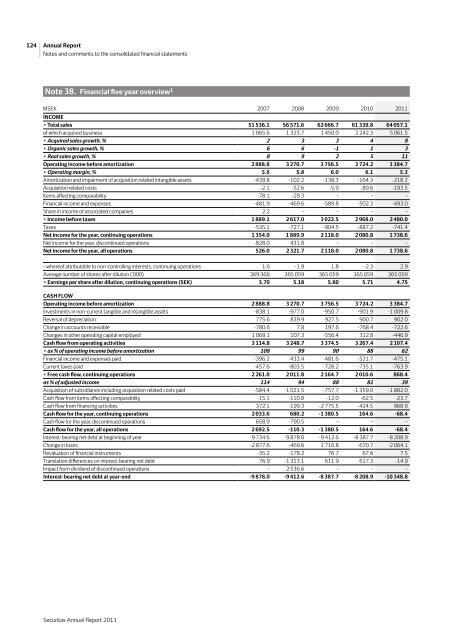
Note 38. Financial five year overview 1<br />
MSEK 2007 2008 2009 2010 <strong>2011</strong><br />
INCOME<br />
• Total sales 51 536.1 56 571.6 62 666.7 61 339.8 64 057.1<br />
of which acquired business 1 065.6 1 323.7 1 450.0 2 242.3 5 061.5<br />
• Acquired sales growth, % 2 3 3 4 8<br />
• Organic sales growth, % 6 6 -1 1 3<br />
• Real sales growth, % 8 9 2 5 11<br />
Operating income before amortization 2 888.8 3 270.7 3 756.5 3 724.2 3 384.7<br />
• Operating margin, % 5.6 5.8 6.0 6.1 5.3<br />
Amortization and impairment of acquisition related intangible assets -439.8 -102.2 -138.3 -164.3 -218.2<br />
Acquisition related costs -2.1 -52.6 -5.9 -89.6 -193.5<br />
Items affecting comparability -78.1 -29.3 – – –<br />
financial income and expenses -481.9 -469.6 -589.8 -502.3 -493.0<br />
Share in income of associated companies 2.2 – – – –<br />
• Income before taxes 1 889.1 2 617.0 3 022.5 2 968.0 2 480.0<br />
Taxes -535.1 -727.1 -904.5 -887.2 -741.4<br />
Net income for the year, continuing operations 1 354.0 1 889.9 2 118.0 2 080.8 1 738.6<br />
Net income for the year, discontinued operations -828.0 431.8 – – –<br />
Net income for the year, all operations 526.0 2 321.7 2 118.0 2 080.8 1 738.6<br />
– whereof attributable to non-controlling interests, continuing operations 1.6 -1.9 1.8 -2.3 2.9<br />
Average number of shares after dilution (‘000) 369 366 365 059 365 059 365 059 365 059<br />
• Earnings per share after dilution, continuing operations (SEK) 3.70 5.18 5.80 5.71 4.75<br />
CASH FLOW<br />
Operating income before amortization 2 888.8 3 270.7 3 756.5 3 724.2 3 384.7<br />
Investments in non-current tangible and intangible assets -838.1 -977.0 -950.7 -901.9 -1 009.8<br />
Reversal of depreciation 775.6 839.9 927.5 900.7 902.0<br />
Change in accounts receivable -780.6 7.8 197.6 -768.4 -722.6<br />
Changes in other operating capital employed 1 069.1 107.3 -556.4 312.8 -446.9<br />
Cash flow from operating activities 3 114.8 3 248.7 3 374.5 3 267.4 2 107.4<br />
• as % of operating income before amortization 108 99 90 88 62<br />
financial income and expenses paid -396.2 -433.4 -481.6 -521.7 -475.1<br />
Current taxes paid -457.6 -803.5 -728.2 -735.1 -763.9<br />
• Free cash flow, continuing operations 2 261.0 2 011.8 2 164.7 2 010.6 868.4<br />
as % of adjusted income 114 94 88 81 39<br />
Acquisition of subsidiaries including acquisition related costs paid -584.4 -1 021.5 -757.7 -1 359.0 -1 882.0<br />
Cash flow from items affecting comparability -15.1 -110.8 -12.0 -62.5 -23.7<br />
Cash flow from financing activities 372.1 -199.3 -2 775.5 -424.5 968.9<br />
Cash flow for the year, continuing operations 2 033.6 680.2 -1 380.5 164.6 -68.4<br />
Cash flow for the year, discontinued operations 658.9 -790.5 – – –<br />
Cash flow for the year, all operations 2 692.5 -110.3 -1 380.5 164.6 -68.4<br />
Interest-bearing net debt at beginning of year -9 734.6 -9 878.0 -9 412.6 -8 387.7 -8 208.9<br />
Change in loans -2 877.6 -469.6 1 716.8 -670.7 -2 064.1<br />
Revaluation of financial instruments -35.2 -178.2 76.7 67.6 7.5<br />
Translation differences on interest-bearing net debt 76.9 -1 313.1 611.9 617.3 -14.9<br />
Impact from dividend of discontinued operations – 2 536.6 – – –<br />
Interest-bearing net debt at year-end -9 878.0 -9 412.6 -8 387.7 -8 208.9 -10 348.8<br />
Securitas <strong>Annual</strong> <strong>Report</strong> <strong>2011</strong>