Wave Propagation in Linear Media | re-examined
Wave Propagation in Linear Media | re-examined
Wave Propagation in Linear Media | re-examined

You also want an ePaper? Increase the reach of your titles
YUMPU automatically turns print PDFs into web optimized ePapers that Google loves.
0.75<br />
0.5<br />
0.25<br />
-0.25<br />
-0.5<br />
-0.75<br />
U/U0<br />
1<br />
50 100 150 200 T<br />
3<strong>Wave</strong> propagation <strong>in</strong> electromagnetic transmission l<strong>in</strong>es<br />
|A|<br />
4<br />
3<br />
2<br />
1<br />
-2 -1 1 2 η<br />
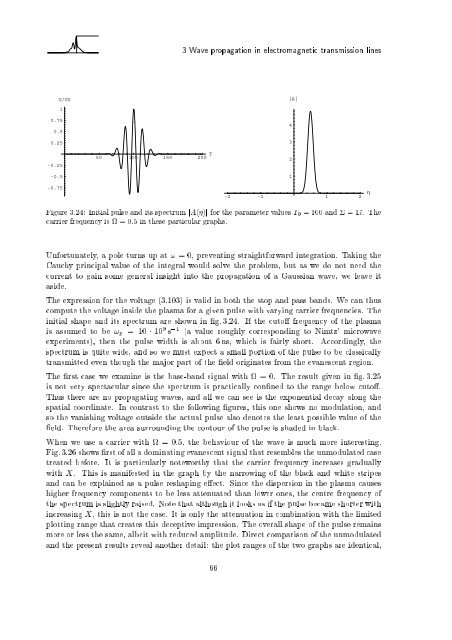
Figu<strong>re</strong> 3.24: Initial pulse and its spectrum jA( )j for the parameter values T0 = 100 and = 17. The<br />
carrier f<strong>re</strong>quency is = 0:5 <strong>in</strong> these particular graphs.<br />
Unfortunately, a pole turns up at ! =0,p<strong>re</strong>vent<strong>in</strong>g straightforward <strong>in</strong>tegration. Tak<strong>in</strong>g the<br />
Cauchy pr<strong>in</strong>cipal value of the <strong>in</strong>tegral would solve the problem, but as we do not need the<br />
cur<strong>re</strong>nt to ga<strong>in</strong> some general <strong>in</strong>sight <strong>in</strong>to the propagation of a Gaussian wave, we leave it<br />
aside.<br />
The exp<strong>re</strong>ssion for the voltage (3.103) is valid <strong>in</strong> both the stop and pass bands. We can thus<br />
compute the voltage <strong>in</strong>side the plasma for a given pulse with vary<strong>in</strong>g carrier f<strong>re</strong>quencies. The<br />
<strong>in</strong>itial shape and its spectrum a<strong>re</strong> shown <strong>in</strong> g. 3.24. If the cuto f<strong>re</strong>quency of the plasma<br />
is assumed to be !p = 10 10 9 s ,1 (a value roughly cor<strong>re</strong>spond<strong>in</strong>g to Nimtz' microwave<br />
experiments), then the pulse width is about 6 ns, which is fairly short. Accord<strong>in</strong>gly, the<br />
spectrum is quite wide, and so we must expect a small portion of the pulse to be classically<br />
transmitted even though the major part of the eld orig<strong>in</strong>ates from the evanescent <strong>re</strong>gion.<br />
The rst case we exam<strong>in</strong>e is the base-band signal with =0. The <strong>re</strong>sult given <strong>in</strong> g. 3.25<br />
is not very spectacular s<strong>in</strong>ce the spectrum is practically con ned to the range below cuto .<br />
Thus the<strong>re</strong> a<strong>re</strong> no propagat<strong>in</strong>g waves, and all we can see is the exponential decay along the<br />
spatial coord<strong>in</strong>ate. In contrast to the follow<strong>in</strong>g gu<strong>re</strong>s, this one shows no modulation, and<br />
so the vanish<strong>in</strong>g voltage outside the actual pulse also denotes the least possible value of the<br />
eld. The<strong>re</strong>fo<strong>re</strong> the a<strong>re</strong>a surround<strong>in</strong>g the contour of the pulse is shaded <strong>in</strong> black.<br />
When we use a carrier with = 0:5, the behaviour of the wave is much mo<strong>re</strong> <strong>in</strong>te<strong>re</strong>st<strong>in</strong>g.<br />
Fig. 3.26 shows rst of all a dom<strong>in</strong>at<strong>in</strong>g evanescent signal that <strong>re</strong>sembles the unmodulated case<br />
t<strong>re</strong>ated befo<strong>re</strong>. It is particularly noteworthy that the carrier f<strong>re</strong>quency <strong>in</strong>c<strong>re</strong>ases gradually<br />
with X. This is manifested <strong>in</strong> the graph by the narrow<strong>in</strong>g of the black and white stripes<br />
and can be expla<strong>in</strong>ed as a pulse <strong>re</strong>shap<strong>in</strong>g e ect. S<strong>in</strong>ce the dispersion <strong>in</strong> the plasma causes<br />
higher f<strong>re</strong>quency components to be less attenuated than lower ones, the cent<strong>re</strong> f<strong>re</strong>quency of<br />
the spectrum is slightly raised. Note that although it looks as if the pulse became shorter with<br />
<strong>in</strong>c<strong>re</strong>as<strong>in</strong>g X, this is not the case. It is only the attenuation <strong>in</strong> comb<strong>in</strong>ation with the limited<br />
plott<strong>in</strong>g range that c<strong>re</strong>ates this deceptive imp<strong>re</strong>ssion. The overall shape of the pulse <strong>re</strong>ma<strong>in</strong>s<br />
mo<strong>re</strong> or less the same, albeit with <strong>re</strong>duced amplitude. Di<strong>re</strong>ct comparison of the unmodulated<br />
and the p<strong>re</strong>sent <strong>re</strong>sults <strong>re</strong>veal another detail: the plot ranges of the two graphs a<strong>re</strong> identical,<br />
66