Interim report of the HELCOM CORESET project
Interim report of the HELCOM CORESET project
Interim report of the HELCOM CORESET project

You also want an ePaper? Increase the reach of your titles
YUMPU automatically turns print PDFs into web optimized ePapers that Google loves.
The majority <strong>of</strong> studies to date have used haemolymph and gill cells <strong>of</strong> molluscs and peripheral blood<br />
cells <strong>of</strong> fi sh for <strong>the</strong> MN analysis (Bolognesi & Hayashi 2011). There are o<strong>the</strong>r studies (albeit limited) available<br />
describing <strong>the</strong> use <strong>of</strong> o<strong>the</strong>r haemopoetic tissues, such as liver, kidney, gills, and also fi ns (Archipchuk<br />
& Garanko 2005; Baršienė et al. 2006a; Rybakovas et al. 2009). The application <strong>of</strong> <strong>the</strong> MN assay to blood<br />
samples <strong>of</strong> fi sh is particularly attractive as <strong>the</strong> method is non-destructive, easy to undertake and results in<br />
an easy quantifi able number <strong>of</strong> cells present on <strong>the</strong> blood smears for microscopic analysis. However, studies<br />
must be undertaken to assess <strong>the</strong> suitability <strong>of</strong> any species or cell type analyzed.<br />
The detected MN frequency in fi sh erythrocytes is approximately 6-10 times lower than in mussels and<br />
clams. The large inter individual variability associated to <strong>the</strong> low baseline frequency for this biomarker<br />
confi rming <strong>the</strong> need for <strong>the</strong> scoring <strong>of</strong> a consistent number <strong>of</strong> cells in an adequate number <strong>of</strong> animals<br />
for each study point. Sampling size in most <strong>of</strong> studies conducted with mollusc species have been scoring<br />
1000-2000 cells per animal (Izquierdo et al. 2003; Hagger et al. 2005; Bolognesi et al. 1996, 2004,<br />
2006a; Magni et al. 2006; Baršienė et al. 2006a, 2006b, 2008b, 2010; Kopecka et al. 2006; Nigro et al.<br />
2006; Schiedek et al. 2006; Francioni et al. 2007; Siu et al. 2008; Koukouzika & Dimitriadis 2005, 2008)<br />
and previous reviews have suggested that when using fi sh erythrocytes at least 2000-4000 cells should<br />
be scored per animal (Udroiu er al. 2006; Bolognesi et al. 2006a). Previously scorings <strong>of</strong> 5000-10000 fi sh<br />
erythrocytes where used for a MN analysis (Baršienė et al. 2004). Since 2009-2010, <strong>the</strong> frequency <strong>of</strong> MN in<br />
fi sh from <strong>the</strong> Baltic seas was mostly scored in 4000 cells. In stressful heavily polluted zones, <strong>the</strong> scoring <strong>of</strong><br />
5000-10000 cells in fi sh is still recommended.<br />
Mussel sampling size in MN assays range from 5 to 20 mussels per site as <strong>report</strong>ed in <strong>the</strong> literature<br />
(Baršienė et al. 2004, 2006c, 2008b; Francioni et al. 2007; Siu et al. 2008). Evidence suggests that a sample<br />
size <strong>of</strong> 10 specimens per site is enough for <strong>the</strong> assessment <strong>of</strong> environmental genotoxicity levels and<br />
evaluation <strong>of</strong> <strong>the</strong> existence <strong>of</strong> genetic risk zones. In heavily polluted sites, MN analysis in 15-20 specimens is<br />
recommended, due to higher individual variation <strong>of</strong> <strong>the</strong> MN frequency. MN analysis in more than 20 mussel<br />
or fi sh specimens shows only a minor change <strong>of</strong> <strong>the</strong> MN means (Fig. 1 in Fang et al. 2009; Baršienė et<br />
al., unpublished results).<br />
Most <strong>of</strong> <strong>the</strong> studies have been performed using diagnostic criteria for MN identifi cation developed by<br />
several authors (Heddle et al. 1973, 1991; Carrasco et al. 1990; Al-Sabti & Metcalfe 1995; Fenech 2000;<br />
Fenech et al. 2003):<br />
– <strong>the</strong> size <strong>of</strong> MN is smaller than 1/3 <strong>of</strong> <strong>the</strong> main nucleus;<br />
– MN are round- or ovoid-shaped, non-refractive chromatin bodies located in <strong>the</strong> cytoplasm <strong>of</strong> <strong>the</strong> cell and<br />
can <strong>the</strong>refore be distinguished from artifacts such as staining particles;<br />
– MN are not connected to <strong>the</strong> main nuclei and <strong>the</strong> micronuclear boundary should be distinguishable from<br />
<strong>the</strong> nuclear boundary.<br />
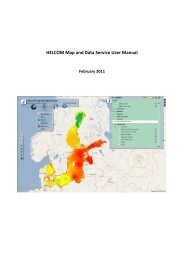
Figure 3.12. Micronuclei in blood erythrocytes <strong>of</strong> (a) herring (Clupea harrengus),(b) fl ounder (Platichthys<br />
fl esus), and (c) in a gill cell <strong>of</strong> <strong>the</strong> mussel Mytilus edulis.<br />
After sampling and cell smears preparation, slides should be coded. To minimize technical variation, <strong>the</strong><br />
blind scoring <strong>of</strong> MN should be performed without knowledge <strong>of</strong> <strong>the</strong> origin <strong>of</strong> <strong>the</strong> samples. Only cells with<br />
intact cellular and nuclear membrane can be scored. Particles with color intensity higher than that <strong>of</strong> <strong>the</strong><br />
139