- Page 1 and 2:
Product Guide McAfee ® version 7.1
- Page 3 and 4:
Contents Preface 9 About this guide
- Page 5 and 6:
Contents Standard authentication .
- Page 7 and 8:
Contents Create an error handler .
- Page 9 and 10:
Preface About this guide This Produ
- Page 11 and 12:
Table i-2 Acronyms (continued) Acro
- Page 13 and 14:
1 Introduction Contents Comprehensi
- Page 15 and 16:
Deployment of the McAfee Web Gatewa
- Page 17 and 18:
Operating system Introduction Filte
- Page 19 and 20:
Introduction Chapters of this guide
- Page 21 and 22:
2 Setup and logon Contents Setting
- Page 23 and 24:
Setup and logon Setting up the McAf
- Page 25 and 26:
Installing the appliance software S
- Page 27 and 28:
2 Review the summary that is displa
- Page 29 and 30:
Import a license Setup and logon Lo
- Page 31 and 32:
Main elements of the user interface
- Page 33 and 34:
Setting up system management tools
- Page 35 and 36:
Setup and logon Setting up system m
- Page 37 and 38:
3 Proxies and caching Contents Inte
- Page 39 and 40:
Explicit proxy mode Proxies and cac
- Page 41 and 42:
Table 3-1 WCCP Services list (conti
- Page 43 and 44:
Proxies and caching Network modes 3
- Page 45 and 46:
Transparent bridge mode Proxies and
- Page 47 and 48:
Proxies and caching Network modes 3
- Page 49 and 50:
Transparent router mode Proxies and
- Page 51 and 52:
Proxies and caching Network modes 3
- Page 53 and 54:
Common proxy settings Proxies and c
- Page 55 and 56:
Proxies and caching Common proxy se
- Page 57 and 58:
Proxies and caching Common proxy se
- Page 59 and 60:
Proxies and caching Common proxy se
- Page 61 and 62:
8 Make sure the following is config
- Page 63 and 64:
Proxies and caching Reverse HTTPS p
- Page 65 and 66:
Proxies and caching Reverse HTTPS p
- Page 67 and 68:
Proxies and caching Reverse HTTPS p
- Page 69 and 70:
Proxies and caching Reverse HTTPS p
- Page 71 and 72:
Proxies and caching Providing proxy
- Page 73 and 74:
Preventing data leaks Proxies and c
- Page 75 and 76:
Web caching Proxies and caching Web
- Page 77 and 78:
Bypass lists for web caching Proxie
- Page 79 and 80:
Verify the enabling of the web cach
- Page 81 and 82:
4 Rules and rule sets Contents Filt
- Page 83 and 84:
Rules and rule sets Filtering contr
- Page 85 and 86:
Modules for delivering filtering in
- Page 87 and 88:
Rules on the user interface On the
- Page 89 and 90:
Property of a URL Property — URL.
- Page 91 and 92:
About rule sets Rules and rule sets
- Page 93 and 94:
Rules and rule sets About rule sets
- Page 95 and 96:
Table 4-4 Rule set library Rule set
- Page 97 and 98:
The Rule Sets toolbar provides the
- Page 99 and 100:
Add name, comment, and enabling Com
- Page 101 and 102:
Add as many parameters as needed. A
- Page 103 and 104:
3 Select Event. The Add Event windo
- Page 105 and 106:
Adding the action 9 Select Action.
- Page 107 and 108:
Rules and rule sets Rule configurat
- Page 109 and 110:
Add a new rule set You can also cre
- Page 111 and 112:
List maintenance Rules and rule set
- Page 113 and 114:
Add a list Complete the following p
- Page 115 and 116:
Action and engine settings Rules an
- Page 117 and 118:
Access restrictions Rules and rule
- Page 119 and 120:
5 Filtering users Authentication an
- Page 121 and 122:
Authentication and access managemen
- Page 123 and 124:
Authentication and access managemen
- Page 125 and 126:
Authentication and access managemen
- Page 127 and 128:
Module for authenticating users Aut
- Page 129 and 130:
Authentication and access managemen
- Page 131 and 132:
LDAP Settings specifying the LDAP m
- Page 133 and 134:
Novell eDirectory Settings specifyi
- Page 135 and 136:
Kerberos Settings specifying the Ke
- Page 137 and 138:
Table 5-8 Certificate Authorities l
- Page 139 and 140:
Authentication and access managemen
- Page 141 and 142:
Authentication and access managemen
- Page 143 and 144:
Authentication and access managemen
- Page 145 and 146:
Authentication and access managemen
- Page 147 and 148:
Authentication and access managemen
- Page 149 and 150:
Authentication and access managemen
- Page 151 and 152:
Authentication and access managemen
- Page 153 and 154:
Authentication and access managemen
- Page 155 and 156:
Authentication and access managemen
- Page 157 and 158:
Authentication and access managemen
- Page 159 and 160:
Authentication and access managemen
- Page 161 and 162:
Authentication and access managemen
- Page 163 and 164:
Authentication and access managemen
- Page 165 and 166:
Administrator accounts Authenticati
- Page 167 and 168:
Authentication and access managemen
- Page 169 and 170:
6 Web filtering Contents Filtering
- Page 171 and 172:
Virus and malware filtering Web fil
- Page 173 and 174:
Web filtering Virus and malware fil
- Page 175 and 176:
Web filtering Virus and malware fil
- Page 177 and 178:
Whitelists for virus and malware fi
- Page 179 and 180:
Web filtering Virus and malware fil
- Page 181 and 182:
Module for virus and malware filter
- Page 183 and 184:
Web filtering Virus and malware fil
- Page 185 and 186:
Web filtering Virus and malware fil
- Page 187 and 188:
URL filtering Web filtering URL fil
- Page 189 and 190:
Web filtering URL filtering 6 The B
- Page 191 and 192:
Modify a filtering rule to block un
- Page 193 and 194:
Web filtering URL filtering 6 Add a
- Page 195 and 196:
Module for URL filtering Web filter
- Page 197 and 198:
Web filtering URL filtering 6 Advan
- Page 199 and 200:
Different versions of URL category
- Page 201 and 202:
Web filtering Media type filtering
- Page 203 and 204:
Web filtering Media type filtering
- Page 205 and 206:
Lists for media type filtering Web
- Page 207 and 208:
HTML filtering Web filtering HTML f
- Page 209 and 210:
Web filtering HTML filtering 6 Embe
- Page 211 and 212:
Break; User-Defined.removeOneScript
- Page 213 and 214:
Media Type String Blocklist List of
- Page 215 and 216:
Global whitelists Web filtering Glo
- Page 217 and 218:
Web filtering SSL scanning 6 Handle
- Page 219 and 220:
Block untrusted certificate authori
- Page 221 and 222:
Web filtering SSL scanning 6 Verify
- Page 223 and 224:
Modules for SSL scanning Web filter
- Page 225 and 226: Web filtering SSL scanning 6 SSL Cl
- Page 227 and 228: 8 Click OK. The window closes and t
- Page 229 and 230: The rule set contains the following
- Page 231 and 232: Bandwidth throttling Web filtering
- Page 233 and 234: Next-hop proxies Web filtering Supp
- Page 235 and 236: Web filtering Supporting functions
- Page 237 and 238: User messages Web filtering User me
- Page 239 and 240: The following table describes the o
- Page 241 and 242: Table 6-25 Template Editor (continu
- Page 243 and 244: Web filtering User messages 6 Redir
- Page 245 and 246: 7 System configuration Contents Con
- Page 247 and 248: System settings System configuratio
- Page 249 and 250: Table 7-4 List of sections on syste
- Page 251 and 252: License system settings System conf
- Page 253 and 254: Network Protection system settings
- Page 255 and 256: System configuration System setting
- Page 257 and 258: Database updates Table 7-13 File Ed
- Page 259 and 260: System configuration Database updat
- Page 261 and 262: Configure central management settin
- Page 263 and 264: System configuration Central manage
- Page 265 and 266: Scheduled job settings This section
- Page 267 and 268: System configuration Central manage
- Page 269 and 270: 8 Monitoring Contents Monitoring th
- Page 271 and 272: Monitoring Dashboard 8 Overview of
- Page 273 and 274: Charts and Tables tab Monitoring Da
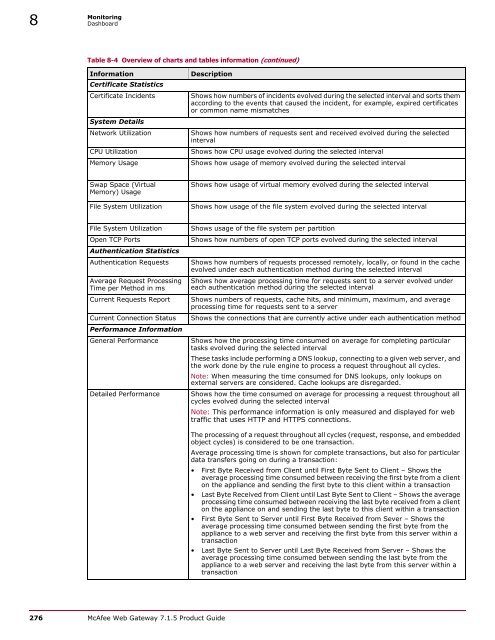
- Page 275: Table 8-4 Overview of charts and ta
- Page 279 and 280: Sample logging rule Monitoring Logg
- Page 281 and 282: 13 Configure the following for the
- Page 283 and 284: Monitoring Logging 8 4 Go to Policy
- Page 285 and 286: + Number.ToString (Block.ID) + “
- Page 287 and 288: Create a rule for setting text as t
- Page 289 and 290: Monitoring Logging 8 • In the Con
- Page 291 and 292: Configuring log file settings Monit
- Page 293 and 294: Monitoring Logging 8 Auto Pushing S
- Page 295 and 296: Log handler rule sets Monitoring Lo
- Page 297 and 298: Performance measurement Monitoring
- Page 299 and 300: Monitoring Performance measurement
- Page 301 and 302: Transferring data to an ePO server
- Page 303 and 304: Event monitoring with SNMP Monitori
- Page 305 and 306: Error handling Table 8-7 Trap Sinks
- Page 307 and 308: Rule sets for error handling Monito
- Page 309 and 310: The rule set contains the following
- Page 311 and 312: Monitoring Error handling 8 Handle
- Page 313 and 314: Monitoring Error handling 8 Block o
- Page 315 and 316: 9 Troubleshooting Contents Troubles
- Page 317 and 318: Enable the creation of connection t
- Page 319 and 320: List of actions Appendix: Configura
- Page 321 and 322: Table A-2 List of error IDs (contin
- Page 323 and 324: Table A-3 List of events (continued
- Page 325 and 326: Table A-3 List of events (continued
- Page 327 and 328:
List of incident IDs Appendix: Conf
- Page 329 and 330:
Table A-4 List of incident IDs (con
- Page 331 and 332:
Table A-5 List of properties (conti
- Page 333 and 334:
Table A-5 List of properties (conti
- Page 335 and 336:
Table A-5 List of properties (conti
- Page 337 and 338:
Table A-5 List of properties (conti
- Page 339 and 340:
Table A-5 List of properties (conti
- Page 341 and 342:
Table A-5 List of properties (conti
- Page 343 and 344:
Table A-5 List of properties (conti
- Page 345 and 346:
Table A-5 List of properties (conti
- Page 347 and 348:
Table A-5 List of properties (conti
- Page 349 and 350:
Table A-5 List of properties (conti
- Page 351 and 352:
Table A-5 List of properties (conti
- Page 353 and 354:
Table A-5 List of properties (conti
- Page 355 and 356:
Table A-5 List of properties (conti
- Page 357 and 358:
Table A-5 List of properties (conti
- Page 359 and 360:
Table A-5 List of properties (conti
- Page 361 and 362:
Table A-5 List of properties (conti
- Page 363 and 364:
Table A-5 List of properties (conti
- Page 365 and 366:
Table A-5 List of properties (conti
- Page 367 and 368:
Wildcard expressions Appendix: Conf
- Page 369 and 370:
Table A-6 List of important special
- Page 371 and 372:
Table A-7 List of important special
- Page 373 and 374:
Index A access restrictions 117 act
- Page 375 and 376:
I ICAP server, see proxies ICQ, see
- Page 377 and 378:
SNMP monitoring 303 SSL scanning Ce
- Page 380:
700-3299A00