

Crown Land: Indicators and Statistics - Ministry of Forests
Crown Land: Indicators and Statistics - Ministry of Forests
Crown Land: Indicators and Statistics - Ministry of Forests

Create successful ePaper yourself
Turn your PDF publications into a flip-book with our unique Google optimized e-Paper software.
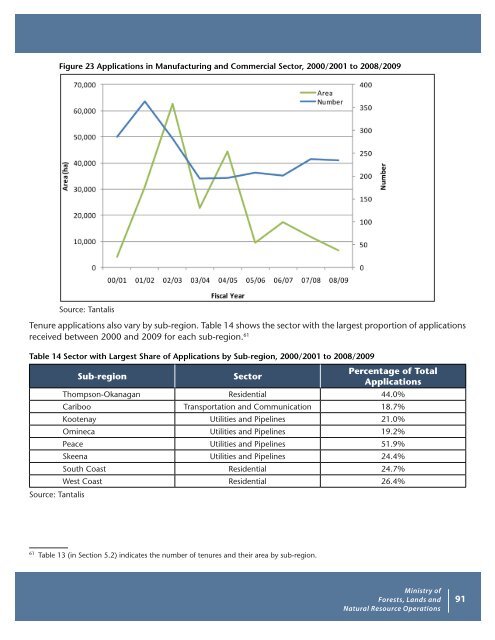
Figure 23 Applications in Manufacturing <strong>and</strong> Commercial Sector, 2000/2001 to 2008/2009<br />
Source: Tantalis<br />
Tenure applications also vary by sub-region. Table 14 shows the sector with the largest proportion <strong>of</strong> applications<br />
received between 2000 <strong>and</strong> 2009 for each sub-region. 61<br />
Table 14 Sector with Largest Share <strong>of</strong> Applications by Sub-region, 2000/2001 to 2008/2009<br />
Source: Tantalis<br />
Sub-region Sector<br />
Percentage <strong>of</strong> Total<br />
Applications<br />
Thompson-Okanagan Residential 44.0%<br />
Cariboo Transportation <strong>and</strong> Communication 18.7%<br />
Kootenay Utilities <strong>and</strong> Pipelines 21.0%<br />
Omineca Utilities <strong>and</strong> Pipelines 19.2%<br />
Peace Utilities <strong>and</strong> Pipelines 51.9%<br />
Skeena Utilities <strong>and</strong> Pipelines 24.4%<br />
South Coast Residential 24.7%<br />
West Coast Residential 26.4%<br />
61 Table 13 (in Section 5.2) indicates the number <strong>of</strong> tenures <strong>and</strong> their area by sub-region.<br />
<strong>Ministry</strong> <strong>of</strong><br />
<strong>Forests</strong>, <strong>L<strong>and</strong></strong>s <strong>and</strong><br />
Natural Resource Operations<br />
91


