

Crown Land: Indicators and Statistics - Ministry of Forests
Crown Land: Indicators and Statistics - Ministry of Forests
Crown Land: Indicators and Statistics - Ministry of Forests

Create successful ePaper yourself
Turn your PDF publications into a flip-book with our unique Google optimized e-Paper software.
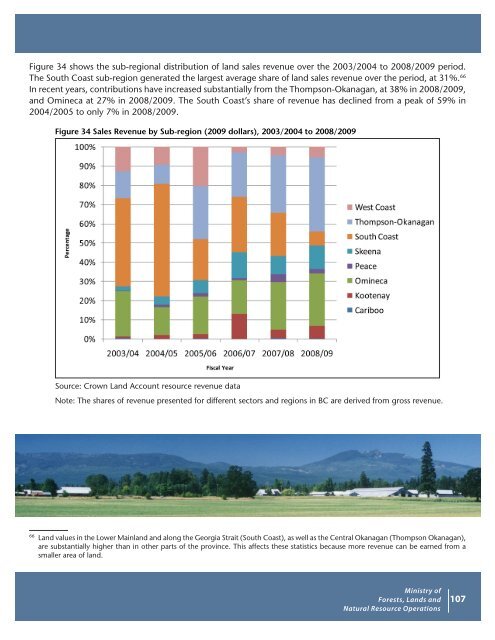
Figure 34 shows the sub-regional distribution <strong>of</strong> l<strong>and</strong> sales revenue over the 2003/2004 to 2008/2009 period.<br />
The South Coast sub-region generated the largest average share <strong>of</strong> l<strong>and</strong> sales revenue over the period, at 31%. 66<br />
In recent years, contributions have increased substantially from the Thompson-Okanagan, at 38% in 2008/2009,<br />
<strong>and</strong> Omineca at 27% in 2008/2009. The South Coast’s share <strong>of</strong> revenue has declined from a peak <strong>of</strong> 59% in<br />
2004/2005 to only 7% in 2008/2009.<br />
Figure 34 Sales Revenue by Sub-region (2009 dollars), 2003/2004 to 2008/2009<br />
Source: <strong>Crown</strong> <strong>L<strong>and</strong></strong> Account resource revenue data<br />
Note: The shares <strong>of</strong> revenue presented for different sectors <strong>and</strong> regions in BC are derived from gross revenue.<br />
66 <strong>L<strong>and</strong></strong> values in the Lower Mainl<strong>and</strong> <strong>and</strong> along the Georgia Strait (South Coast), as well as the Central Okanagan (Thompson Okanagan),<br />
are substantially higher than in other parts <strong>of</strong> the province. This affects these statistics because more revenue can be earned from a<br />
smaller area <strong>of</strong> l<strong>and</strong>.<br />
<strong>Ministry</strong> <strong>of</strong><br />
<strong>Forests</strong>, <strong>L<strong>and</strong></strong>s <strong>and</strong><br />
Natural Resource Operations<br />
107


