Financial Statements - Solvay
Financial Statements - Solvay
Financial Statements - Solvay

Create successful ePaper yourself
Turn your PDF publications into a flip-book with our unique Google optimized e-Paper software.
18<br />
<strong>Solvay</strong> Global Annual Report 2008<br />
<strong>Financial</strong> Information per Share<br />
Earnings per share<br />
Net income of the Group (EUR 449 million) declined<br />
by 46% compared with 2007. Minority interests are<br />
EUR 44 million compared with EUR 47 million in 2007.<br />
Net earnings per share amounts to EUR 4.92 in 2008<br />
(EUR 9.46 in 2007).<br />
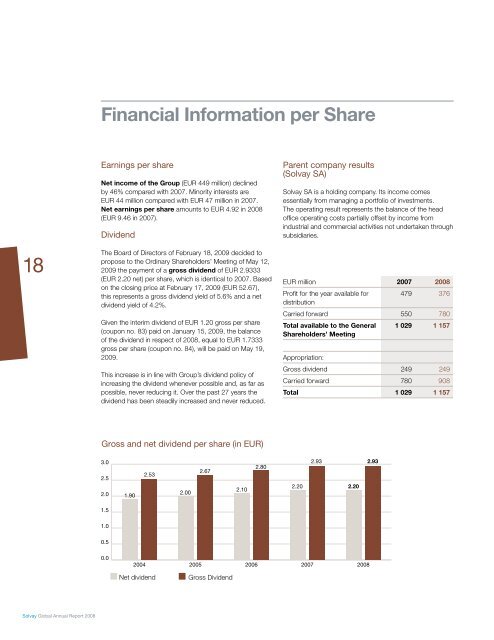
Dividend<br />
The Board of Directors of February 18, 2009 decided to<br />
propose to the Ordinary Shareholders’ Meeting of May 12,<br />
2009 the payment of a gross dividend of EUR 2.9333<br />
(EUR 2.20 net) per share, which is identical to 2007. Based<br />
on the closing price at February 17, 2009 (EUR 52.67),<br />
this represents a gross dividend yield of 5.6% and a net<br />
dividend yield of 4.2%.<br />
Given the interim dividend of EUR 1.20 gross per share<br />
(coupon no. 83) paid on January 15, 2009, the balance<br />
of the dividend in respect of 2008, equal to EUR 1.7333<br />
gross per share (coupon no. 84), will be paid on May 19,<br />
2009.<br />
This increase is in line with Group’s dividend policy of<br />
increasing the dividend whenever possible and, as far as<br />
possible, never reducing it. Over the past 27 years the<br />
dividend has been steadily increased and never reduced.<br />
Gross and net dividend per share (in EUR)<br />
3.0<br />
2.5<br />
2.0<br />
1.5<br />
1.0<br />
0.5<br />
0.0<br />
����<br />
2004<br />
����<br />
����<br />
2005<br />
����<br />
Net dividend Gross Dividend<br />
����<br />
2006<br />
����<br />
Parent company results<br />
(<strong>Solvay</strong> SA)<br />
<strong>Solvay</strong> SA is a holding company. Its income comes<br />
essentially from managing a portfolio of investments.<br />
The operating result represents the balance of the head<br />
offi ce operating costs partially offset by income from<br />
industrial and commercial activities not undertaken through<br />
subsidiaries.<br />
EUR million 2007 2008<br />
Profi t for the year available for<br />
distribution<br />
479 376<br />
Carried forward 550 780<br />
Total available to the General<br />
Shareholders’ Meeting<br />
1 029 1 157<br />
Appropriation:<br />
Gross dividend 249 249<br />
Carried forward 780 908<br />
Total 1 029 1 157<br />
����<br />
2007<br />
����<br />
2.20<br />
2008<br />
2.93


![PROC.1 [LETTRE] - Solvay](https://img.yumpu.com/16585746/1/184x260/proc1-lettre-solvay.jpg?quality=85)