Financial Statements - Solvay
Financial Statements - Solvay
Financial Statements - Solvay

Create successful ePaper yourself
Turn your PDF publications into a flip-book with our unique Google optimized e-Paper software.
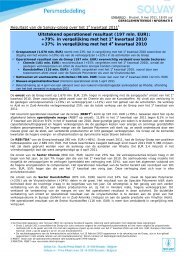
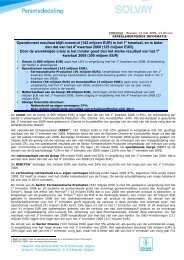
70<br />
<strong>Solvay</strong> Global Annual Report 2008<br />
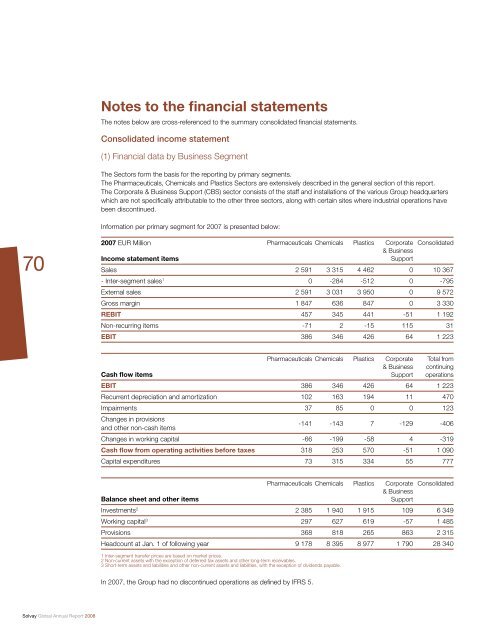
Notes to the fi nancial statements<br />
The notes below are cross-referenced to the summary consolidated fi nancial statements.<br />
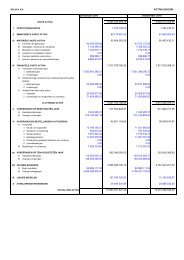
Consolidated income statement<br />
(1) <strong>Financial</strong> data by Business Segment<br />
The Sectors form the basis for the reporting by primary segments.<br />
The Pharmaceuticals, Chemicals and Plastics Sectors are extensively described in the general section of this report.<br />
The Corporate & Business Support (CBS) sector consists of the staff and installations of the various Group headquarters<br />
which are not specifi cally attributable to the other three sectors, along with certain sites where industrial operations have<br />
been discontinued.<br />
Information per primary segment for 2007 is presented below:<br />
2007 EUR Million<br />
Income statement items<br />
Pharmaceuticals Chemicals Plastics Corporate<br />
& Business<br />
Support<br />
Consolidated<br />
Sales 2 591 3 315 4 462 0 10 367<br />
- Inter-segment sales1 0 -284 -512 0 -795<br />
External sales 2 591 3 031 3 950 0 9 572<br />
Gross margin 1 847 636 847 0 3 330<br />
REBIT 457 345 441 -51 1 192<br />
Non-recurring items -71 2 -15 115 31<br />
EBIT 386 346 426 64 1 223<br />
Pharmaceuticals Chemicals Plastics Corporate Total from<br />
& Business continuing<br />
Cash fl ow items<br />
Support operations<br />
EBIT 386 346 426 64 1 223<br />
Recurrent depreciation and amortization 102 163 194 11 470<br />
Impairments 37 85 0 0 123<br />
Changes in provisions<br />
and other non-cash items<br />
-141 -143 7 -129 -406<br />
Changes in working capital -66 -199 -58 4 -319<br />
Cash fl ow from operating activities before taxes 318 253 570 -51 1 090<br />
Capital expenditures 73 315 334 55 777<br />
Balance sheet and other items<br />
Pharmaceuticals Chemicals Plastics Corporate<br />
& Business<br />
Support<br />
Consolidated<br />
Investments2 2 385 1 940 1 915 109 6 349<br />
Working capital3 297 627 619 -57 1 485<br />
Provisions 368 818 265 863 2 315<br />
Headcount at Jan. 1 of following year 9 178 8 395 8 977 1 790 28 340<br />
1 Inter-segment transfer prices are based on market prices.<br />
2 Non-current assets with the exception of deferred tax assets and other long-term receivables.<br />
3 Short-term assets and liabilities and other non-current assets and liabilities, with the exception of dividends payable.<br />
In 2007, the Group had no discontinued operations as defi ned by IFRS 5.


![PROC.1 [LETTRE] - Solvay](https://img.yumpu.com/16585746/1/184x260/proc1-lettre-solvay.jpg?quality=85)