Financial Statements - Solvay
Financial Statements - Solvay
Financial Statements - Solvay

You also want an ePaper? Increase the reach of your titles
YUMPU automatically turns print PDFs into web optimized ePapers that Google loves.
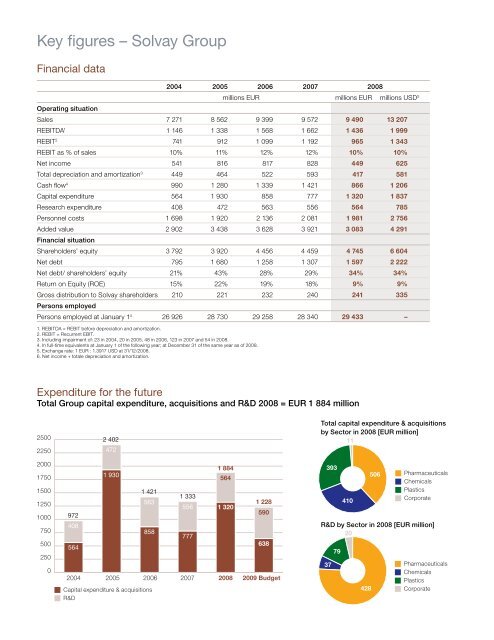
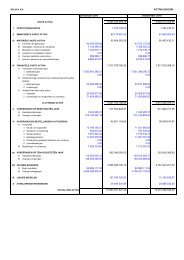
Key fi gures – <strong>Solvay</strong> Group<br />
<strong>Financial</strong> data<br />
2004 2005 2006 2007 2008<br />
millions EUR millions EUR millions USD5 Operating situation<br />
Sales 7 271 8 562 9 399 9 572 9 490 13 207<br />
REBITDA 1 1 146 1 338 1 568 1 662 1 436 1 999<br />
REBIT 2 741 912 1 099 1 192 965 1 343<br />
REBIT as % of sales 10% 11% 12% 12% 10% 10%<br />
Net income 541 816 817 828 449 625<br />
Total depreciation and amortization 3 449 464 522 593 417 581<br />
Cash fl ow 4 990 1 280 1 339 1 421 866 1 206<br />
Capital expenditure 564 1 930 858 777 1 320 1 837<br />
Research expenditure 408 472 563 556 564 785<br />
Personnel costs 1 698 1 920 2 136 2 081 1 981 2 756<br />
Added value 2 902 3 438 3 628 3 921 3 083 4 291<br />
<strong>Financial</strong> situation<br />
Shareholders’ equity 3 792 3 920 4 456 4 459 4 745 6 604<br />
Net debt 795 1 680 1 258 1 307 1 597 2 222<br />
Net debt/ shareholders’ equity 21% 43% 28% 29% 34% 34%<br />
Return on Equity (ROE) 15% 22% 19% 18% 9% 9%<br />
Gross distribution to <strong>Solvay</strong> shareholders 210 221 232 240 241 335<br />
Persons employed<br />
Persons employed at January 14 26 926 28 730 29 258 28 340 29 433 –<br />
1. REBITDA = REBIT before depreciation and amortization.<br />
2. REBIT = Recurrent EBIT.<br />
3. Including impairment of: 23 in 2004, 20 in 2005, 48 in 2006, 123 in 2007 and 54 in 2008.<br />
4. In full-time equivalents at January 1 of the following year; at December 31 of the same year as of 2008.<br />
5. Exchange rate: 1 EUR : 1.3917 USD at 31/12/2008.<br />
6. Net income + totale depreciation and amortization.<br />
Expenditure for the future<br />
Total Group capital expenditure, acquisitions and R&D 2008 = EUR 1 884 million<br />
2500<br />
2250<br />
2000<br />
1750<br />
1500<br />
1250<br />
1000<br />
750<br />
500<br />
250<br />
0<br />
972<br />
408<br />
564<br />
2 402<br />
472<br />
1 930<br />
1 421<br />
563<br />
858<br />
1 333<br />
2004 2005 2006 2007 2008 2009 Budget<br />
� Capital expenditure & acquisitions<br />
� R&D<br />
556<br />
777<br />
1 884<br />
564<br />
1 320<br />
1 228<br />
590<br />
638<br />
Total capital expenditure & acquisitions<br />
by Sector in 2008 [EUR million]<br />
11<br />
393<br />
37<br />
79<br />
410<br />
428<br />
506<br />
� Pharmaceuticals<br />
� Chemicals<br />
� Plastics<br />
� Corporate<br />
R&D by Sector in 2008 [EUR million]<br />
20<br />
� Pharmaceuticals<br />
� Chemicals<br />
� Plastics<br />
� Corporate


![PROC.1 [LETTRE] - Solvay](https://img.yumpu.com/16585746/1/184x260/proc1-lettre-solvay.jpg?quality=85)