Financial Statements - Solvay
Financial Statements - Solvay
Financial Statements - Solvay

Create successful ePaper yourself
Turn your PDF publications into a flip-book with our unique Google optimized e-Paper software.
Current profi t before taxes amounts to EUR 376 million,<br />
compared with EUR 105 million in 2007.<br />
The balance of extraordinary results is EUR -15 million<br />
compared with EUR 330 million in 2007.<br />
Taking into account a EUR 15 million tax credit<br />
(2007: EUR 44 million), the net profi t for the year of<br />
<strong>Solvay</strong> SA amounts in 2008 to EUR 376 million, compared<br />
with EUR 479 million in 2007. In the absence of<br />
transfers to untaxed reserves, net income for the year of<br />
EUR 376 million is available for distribution.<br />
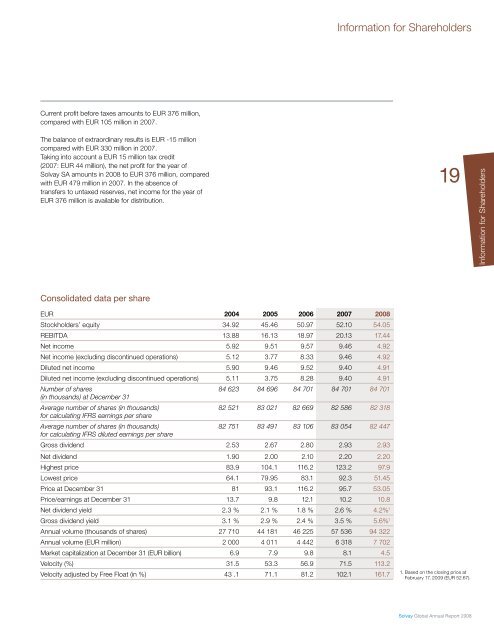
Consolidated data per share<br />
EUR 2004 2005 2006 2007 2008<br />
Stockholders’ equity 34.92 45.46 50.97 52.10 54.05<br />
REBITDA 13.88 16.13 18.97 20.13 17.44<br />
Net income 5.92 9.51 9.57 9.46 4.92<br />
Net income (excluding discontinued operations) 5.12 3.77 8.33 9.46 4.92<br />
Diluted net income 5.90 9.46 9.52 9.40 4.91<br />
Diluted net income (excluding discontinued operations) 5.11 3.75 8.28 9.40 4.91<br />
Number of shares<br />
(in thousands) at December 31<br />
Average number of shares (in thousands)<br />
for calculating IFRS earnings per share<br />
Average number of shares (in thousands)<br />
for calculating IFRS diluted earnings per share<br />
84 623 84 696 84 701 84 701 84 701<br />
82 521 83 021 82 669 82 586 82 318<br />
82 751 83 491 83 106 83 054 82 447<br />
Gross dividend 2.53 2.67 2.80 2.93 2.93<br />
Net dividend 1.90 2.00 2.10 2.20 2.20<br />
Highest price 83.9 104.1 116.2 123.2 97.9<br />
Lowest price 64.1 79.95 83.1 92.3 51.45<br />
Price at December 31 81 93.1 116.2 95.7 53.05<br />
Price/earnings at December 31 13.7 9.8 12.1 10.2 10.8<br />
Net dividend yield 2.3 % 2.1 % 1.8 % 2.6 % 4.2% 1<br />
Gross dividend yield 3.1 % 2.9 % 2.4 % 3.5 % 5.6% 1<br />
Annual volume (thousands of shares) 27 710 44 181 46 225 57 536 94 322<br />
Annual volume (EUR million) 2 000 4 011 4 442 6 318 7 702<br />
Market capitalization at December 31 (EUR billion) 6.9 7.9 9.8 8.1 4.5<br />
Velocity (%) 31.5 53.3 56.9 71.5 113.2<br />
Velocity adjusted by Free Float (in %) 43 .1 71.1 81.2 102.1 161.7<br />
Information for Shareholders<br />
19<br />
1. Based on the closing price at<br />
February 17, 2009 (EUR 52.67).<br />
<strong>Solvay</strong> Global Annual Report 2008<br />
Information for Shareholders


![PROC.1 [LETTRE] - Solvay](https://img.yumpu.com/16585746/1/184x260/proc1-lettre-solvay.jpg?quality=85)