Financial Statements - Solvay
Financial Statements - Solvay
Financial Statements - Solvay
Create successful ePaper yourself
Turn your PDF publications into a flip-book with our unique Google optimized e-Paper software.
74<br />
<strong>Solvay</strong> Global Annual Report 2008<br />
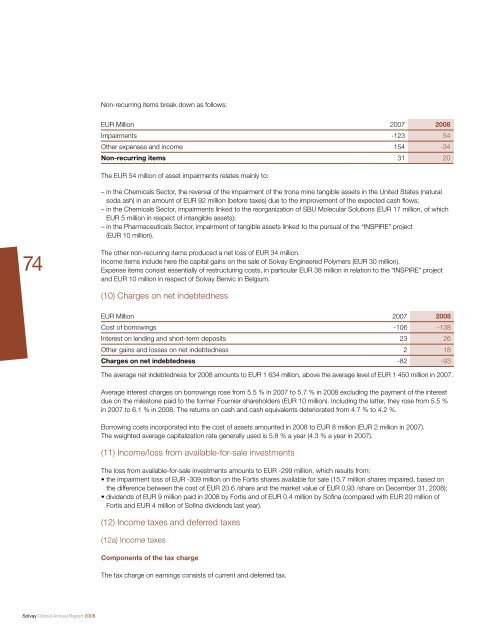
Non-recurring items break down as follows:<br />
EUR Million 2007 2008<br />
Impairments -123 54<br />
Other expenses and income 154 -34<br />
Non-recurring items 31 20<br />
The EUR 54 million of asset impairments relates mainly to:<br />
– in the Chemicals Sector, the reversal of the impairment of the trona mine tangible assets in the United States (natural<br />
soda ash) in an amount of EUR 92 million (before taxes) due to the improvement of the expected cash fl ows;<br />
– in the Chemicals Sector, impairments linked to the reorganization of SBU Molecular Solutions (EUR 17 million, of which<br />
EUR 5 million in respect of intangible assets);<br />
– in the Pharmaceuticals Sector, impairment of tangible assets linked to the pursual of the “INSPIRE” project<br />
(EUR 10 million).<br />
The other non-recurring items produced a net loss of EUR 34 million.<br />
Income items include here the capital gains on the sale of <strong>Solvay</strong> Engineered Polymers (EUR 30 million).<br />
Expense items consist essentially of restructuring costs, in particular EUR 38 million in relation to the “INSPIRE” project<br />
and EUR 10 million in respect of <strong>Solvay</strong> Benvic in Belgium.<br />
(10) Charges on net indebtedness<br />
EUR Million 2007 2008<br />
Cost of borrowings -106 -138<br />
Interest on lending and short-term deposits 23 26<br />
Other gains and losses on net indebtedness 2 18<br />
Charges on net indebtedness -82 -93<br />
The average net indebtedness for 2008 amounts to EUR 1 634 million, above the average level of EUR 1 450 million in 2007.<br />
Average interest charges on borrowings rose from 5.5 % in 2007 to 5.7 % in 2008 excluding the payment of the interest<br />
due on the milestone paid to the former Fournier shareholders (EUR 10 million). Including the latter, they rose from 5.5 %<br />
in 2007 to 6.1 % in 2008. The returns on cash and cash equivalents deteriorated from 4.7 % to 4.2 %.<br />
Borrowing costs incorporated into the cost of assets amounted in 2008 to EUR 8 million (EUR 2 million in 2007).<br />
The weighted average capitalization rate generally used is 5.8 % a year (4.3 % a year in 2007).<br />
(11) Income/loss from available-for-sale investments<br />
The loss from available-for-sale investments amounts to EUR -299 million, which results from:<br />
• the impairment loss of EUR -309 million on the Fortis shares available for sale (15.7 million shares impaired, based on<br />
the difference between the cost of EUR 20.6 /share and the market value of EUR 0.93 /share on December 31, 2008);<br />
• dividends of EUR 9 million paid in 2008 by Fortis and of EUR 0.4 million by Sofi na (compared with EUR 20 million of<br />
Fortis and EUR 4 million of Sofi na dividends last year).<br />
(12) Income taxes and deferred taxes<br />
(12a) Income taxes<br />
Components of the tax charge<br />
The tax charge on earnings consists of current and deferred tax.





![PROC.1 [LETTRE] - Solvay](https://img.yumpu.com/16585746/1/184x260/proc1-lettre-solvay.jpg?quality=85)
