Financial Statements - Solvay
Financial Statements - Solvay
Financial Statements - Solvay

Create successful ePaper yourself
Turn your PDF publications into a flip-book with our unique Google optimized e-Paper software.
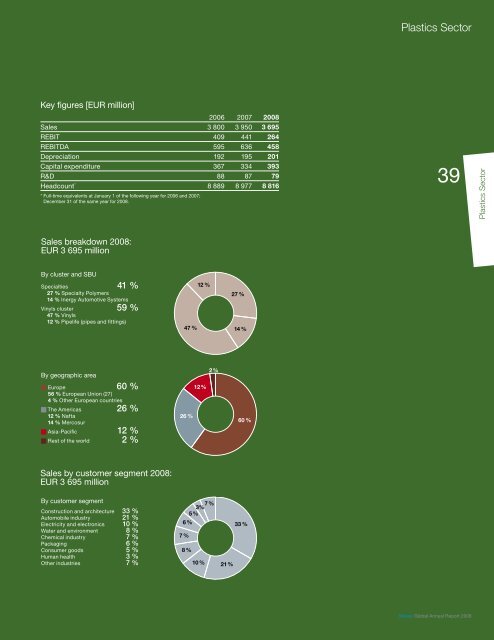
Key fi gures [EUR million]<br />
2006 2007 2008<br />
Sales 3 800 3 950 3 695<br />
REBIT 409 441 264<br />
REBITDA 595 636 458<br />
Depreciation 192 195 201<br />
Capital expenditure 367 334 393<br />
R&D 88 87 79<br />
Headcount * 8 889 8 977 8 816<br />
* Full-time equivalents at January 1 of the following year for 2006 and 2007;<br />
December 31 of the same year for 2008.<br />
Sales breakdown 2008:<br />
EUR 3 695 million<br />
By cluster and SBU<br />
Specialties 41 %<br />
27 % Specialty Polymers<br />
14 % Inergy Automotive Systems<br />
Vinyls cluster 59 %<br />
47 % Vinyls<br />
12 % Pipelife (pipes and fi ttings)<br />
By geographic area<br />
� Europe 60 %<br />
56 % European Union (27)<br />
4 % Other European countries<br />
� The Americas 26 %<br />
12 % Nafta<br />
14 % Mercosur<br />
� Asia-Pacifi c 12 %<br />
� Rest of the world 2 %<br />
Sales by customer segment 2008:<br />
EUR 3 695 million<br />
By customer segment<br />
Construction and architecture 33 %<br />
Automobile industry 21 %<br />
Electricity and electronics 10 %<br />
Water and environment 8 %<br />
Chemical industry 7 %<br />
Packaging 6 %<br />
Consumer goods 5 %<br />
Human health 3 %<br />
Other industries 7 %<br />
47 %<br />
26 %<br />
6 %<br />
7 %<br />
8 %<br />
12 %<br />
12 %<br />
7 %<br />
3%<br />
5 %<br />
10 %<br />
2 %<br />
21 %<br />
27 %<br />
14 %<br />
60 %<br />
33 %<br />
Plastics Sector<br />
39<br />
<strong>Solvay</strong> Global Annual Report 2008<br />
Plastics Sector


![PROC.1 [LETTRE] - Solvay](https://img.yumpu.com/16585746/1/184x260/proc1-lettre-solvay.jpg?quality=85)