Advanced Building Simulation
Advanced Building Simulation
Advanced Building Simulation

You also want an ePaper? Increase the reach of your titles
YUMPU automatically turns print PDFs into web optimized ePapers that Google loves.
25.9<br />
15.9<br />
13.7<br />
10.2<br />
7.2<br />
4.2<br />
0.0<br />
10.0<br />
12.0<br />
10.0<br />
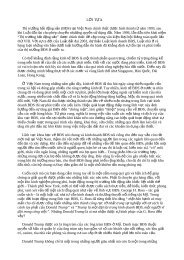
Integrated building airflow simulation 103<br />
10.0 6.0 6.0 10.0<br />
Figure 4.10 Cross-section and plan of atrium with airflow network (dimensions in m).<br />
and connected as indicated in the flow network. For the present study, all openings<br />
are continuously open. Apart from solar gains, there are no other heat gains. There<br />
is no control (heating, cooling, window opening, etc.) imposed on the building.<br />
The ambient conditions are taken from a weather test reference year for<br />
Wuerzburg, which is in the south-western part of Germany. The simulation period<br />
(28 August until 2 September) consists of a 6-day period with increasing outdoor air<br />
temperature to include a range of medium to maximum temperatures.<br />
ESP-r features various modes of time step control. However, in order to avoid<br />
“interferences” which might make it difficult to interpret certain results in the current<br />
case, it was decided not to activate time step control. Instead of time step control, two<br />
time step lengths of respectively one hour and one-tenth of an hour were used during<br />
simulation.<br />
4.3.2.2 Results and discussion<br />
Figure 4.11 shows the simulation results for the vertical airflow through the atrium.<br />
In order to focus on the differences between the various methods, the right hand side<br />
of the figure shows two blown-up parts of the graphs. In the blown-ups, the different<br />
methods can clearly be distinguished. It can be seen that the ping-pong method<br />
with 1-h time steps is clearly an outlier relative to the other cases. For the 6-min time<br />
steps, the onion and ping-pong approaches give almost identical results.<br />
In general, the flows tend to be higher during the night, and becomes less during<br />
the day. This effect is less pronounced during the first day, which has relatively low<br />
ambient air temperatures and levels of solar radiation.<br />
The air temperatures on the ground floor show very little difference between the<br />
various approaches. This is probably due to the fact that the incoming air temperature<br />
(� ambient) is equal in all cases and because of the large thermal capacity of the<br />
ground floor.<br />
Figure 4.12 shows the simulation results for the air temperatures on the top floor.<br />
Here the general graph and the blown-ups show larger differences between the<br />
various approaches. This is due to the succession of differences occurring at the lower<br />
floors and due to the fact that the top floor has a much higher solar gain (via the<br />
transparent roof) than the other floors.