Advanced Building Simulation
Advanced Building Simulation
Advanced Building Simulation

You also want an ePaper? Increase the reach of your titles
YUMPU automatically turns print PDFs into web optimized ePapers that Google loves.
70 Degelman<br />
Dry-bulb temperature (°F)<br />
60<br />
50 +<br />
40<br />
30<br />
20<br />
10<br />
0<br />
+<br />
+<br />
+<br />
+<br />
+<br />
Using the random number generator function is similar to “rolling the dice,” and<br />
is where we finally embrace the concepts on the Monte Carlo method. We start the<br />
process by entering a totally meaningless, 8-digit seed value somewhere between<br />
0 and 1 (e.g. 0.29845718). In our software we call the random number generator<br />
function by the equation, B�RANDOM(B). The number, B, returned is always an<br />
8-digit number between 0.00001 and 1. Next, we multiply this value by 31 and round<br />
up to the next higher integer, creating numbers from 1 to 31. Then, we enter the<br />
y-axis of the CDF curve and read the temperature value from the x-axis, the result<br />
being the temperature value for that day.<br />
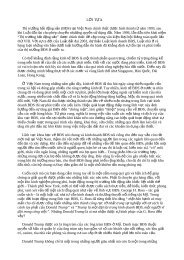
Following this procedure generated the results shown in Figure 3.5 for a selection<br />
of the first 20 days. If one were to select a second set of 20 days, a different sequence<br />
would result. Every time a series of numbers is selected, a different sequence of days<br />
will occur, only repeating the exact sequence after about 100 million trials.<br />
3.4.4 Practical computational methodology<br />
For simplicity in computation of daily temperatures, the means and standard<br />
deviations are “normalized” to a Normal Distribution curve with mean (�)�0, and<br />
standard deviation (�)�1. The 31 possible choices for daily values are shown in<br />
Table 3.1. These values range from a low of �2.11 to a high of 2.11 standard deviations,<br />
with the center point being 0.<br />
For practical software applications, the CDF values f(x) are stored into a dimensioned<br />
array, and the x-value from Table 3.1 is a random variable that only takes on<br />
values from 1 to 31. We’ll call the dimensioned array FNORMAL(31). The computational<br />
sequence is as follows:<br />
(a) Establish X by calling the random number generator and multiplying by 31.<br />
X�31 * RANDOM(rn) (3.7)<br />
where rn is the random number between 0 and 1.<br />
+<br />
+<br />
+<br />
+<br />
+<br />
2 4 6 8 10 12 14 16 18 20<br />
Day of the month (January)<br />
+<br />
+<br />
+<br />
Ave. max. = 37.1°F<br />
Monthly ave.= 30.8°F<br />
Figure 3.5 Monte Carlo generated daily maximum and average temperatures for 20 consecutive days<br />
in January.<br />
+<br />
+<br />
+<br />
+<br />
+<br />
+