Advanced Building Simulation
Advanced Building Simulation
Advanced Building Simulation

Create successful ePaper yourself
Turn your PDF publications into a flip-book with our unique Google optimized e-Paper software.
y the room conditions. In fact, the velocity profile above the jet region represents the<br />
backward airflow towards the displacement diffuser.<br />
Chen and Moser (1991) proposed a momentum method that decouples momentum<br />
and mass boundary conditions for the diffuser in CFD simulation. The diffuser is<br />
represented in the CFD study with an opening that has the same gross area, mass flux,<br />
and momentum flux as a real diffuser does. This model enables specification of the<br />
source terms in the conservation equations over the real diffuser area. The air supply<br />
velocity for the momentum source term is calculated from the mass flow rate, m˙ , and<br />
the diffuser effective area A0: U 0 � m˙ /(� A 0)<br />
CFD tools for indoor environmental design 131<br />
(5.16)<br />
Srebric (2000) demonstrated that the momentum method can produce satisfactory<br />
results, and the method is thus used for this investigation. As one can see, modeling<br />
of a complex flow element requires substantial effort and knowledge.<br />
5.3.6 Change in grid resolution, especially the<br />
resolution near walls<br />
So far we have discussed the establishment of a CFD model for displacement ventilation.<br />
Numerical procedure is equally important in achieving accurate results. In most cases,<br />
one would demand a grid-independent solution. By using Fisher’s case (1995) as an<br />
example, this investigation has used four sets of grids to simulate the indoor airflow:<br />
a coarse grid (22�17�15�5,610 cells), a moderate grid (44�34�30�44,880 cells),<br />
a fine grid (66�51�45�151,470 cells), and a locally refined coarse grid (27�19�<br />
17 �8,721 cells) that has the same resolution in the near-wall regions as the fine grid.<br />
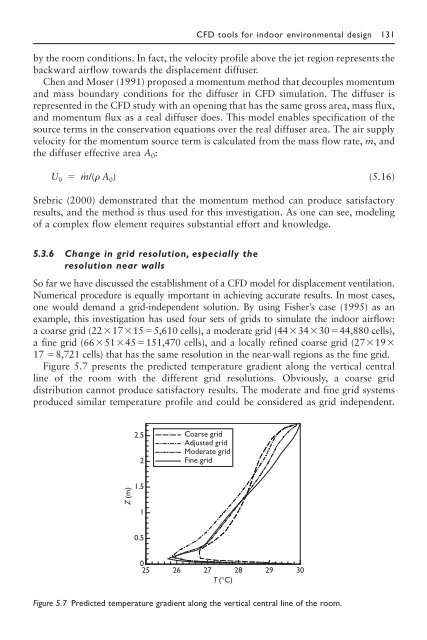
Figure 5.7 presents the predicted temperature gradient along the vertical central<br />
line of the room with the different grid resolutions. Obviously, a coarse grid<br />
distribution cannot produce satisfactory results. The moderate and fine grid systems<br />
produced similar temperature profile and could be considered as grid independent.<br />
Z (m)<br />
2.5<br />
2<br />
1.5<br />
1<br />
0.5<br />
Coarse grid<br />
Adjusted grid<br />
Moderate grid<br />
Fine grid<br />
0<br />
25 26 27 28 29 30<br />
T (°C)<br />
Figure 5.7 Predicted temperature gradient along the vertical central line of the room.