plan de empresa drop sas articulos y accesorios ... - Universidad EAN
plan de empresa drop sas articulos y accesorios ... - Universidad EAN
plan de empresa drop sas articulos y accesorios ... - Universidad EAN

You also want an ePaper? Increase the reach of your titles
YUMPU automatically turns print PDFs into web optimized ePapers that Google loves.
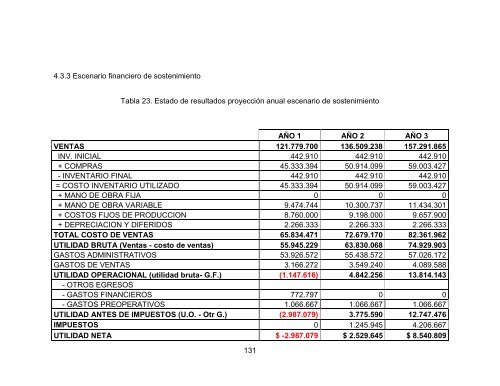
4.3.3 Escenario financiero <strong>de</strong> sostenimiento<br />
Tabla 23. Estado <strong>de</strong> resultados proyección anual escenario <strong>de</strong> sostenimiento<br />
AÑO 1 AÑO 2 AÑO 3<br />
VENTAS 121.779.700 136.509.238 157.291.865<br />
INV. INICIAL 442.910 442.910 442.910<br />
+ COMPRAS 45.333.394 50.914.099 59.003.427<br />
- INVENTARIO FINAL 442.910 442.910 442.910<br />
= COSTO INVENTARIO UTILIZADO 45.333.394 50.914.099 59.003.427<br />
+ MANO DE OBRA FIJA 0 0 0<br />
+ MANO DE OBRA VARIABLE 9.474.744 10.300.737 11.434.301<br />
+ COSTOS FIJOS DE PRODUCCION 8.760.000 9.198.000 9.657.900<br />
+ DEPRECIACION Y DIFERIDOS 2.266.333 2.266.333 2.266.333<br />
TOTAL COSTO DE VENTAS 65.834.471 72.679.170 82.361.962<br />
UTILIDAD BRUTA (Ventas - costo <strong>de</strong> ventas) 55.945.229 63.830.068 74.929.903<br />
GASTOS ADMINISTRATIVOS 53.926.572 55.438.572 57.026.172<br />
GASTOS DE VENTAS 3.166.272 3.549.240 4.089.588<br />
UTILIDAD OPERACIONAL (utilidad bruta- G.F.) (1.147.616) 4.842.256 13.814.143<br />
- OTROS EGRESOS<br />
- GASTOS FINANCIEROS 772.797 0 0<br />
- GASTOS PREOPERATIVOS 1.066.667 1.066.667 1.066.667<br />
UTILIDAD ANTES DE IMPUESTOS (U.O. - Otr G.) (2.987.079) 3.775.590 12.747.476<br />
IMPUESTOS 0 1.245.945 4.206.667<br />
UTILIDAD NETA $ -2.987.079 $ 2.529.645 $ 8.540.809<br />
131