plan de empresa drop sas articulos y accesorios ... - Universidad EAN
plan de empresa drop sas articulos y accesorios ... - Universidad EAN
plan de empresa drop sas articulos y accesorios ... - Universidad EAN

You also want an ePaper? Increase the reach of your titles
YUMPU automatically turns print PDFs into web optimized ePapers that Google loves.
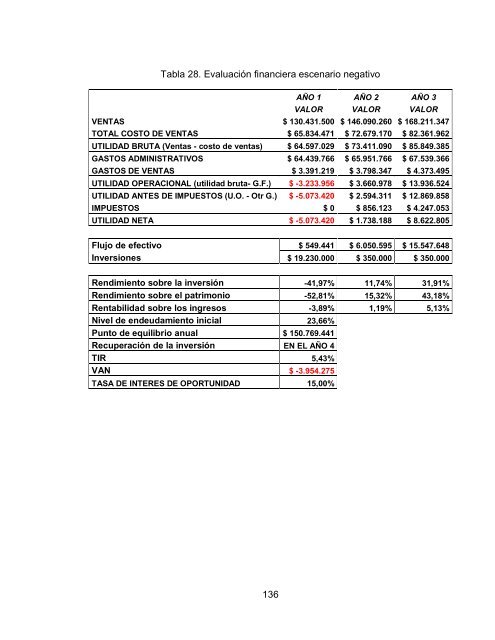
Tabla 28. Evaluación financiera escenario negativo<br />
136<br />
AÑO 1 AÑO 2 AÑO 3<br />
VALOR VALOR VALOR<br />
VENTAS $ 130.431.500 $ 146.090.260 $ 168.211.347<br />
TOTAL COSTO DE VENTAS $ 65.834.471 $ 72.679.170 $ 82.361.962<br />
UTILIDAD BRUTA (Ventas - costo <strong>de</strong> ventas) $ 64.597.029 $ 73.411.090 $ 85.849.385<br />
GASTOS ADMINISTRATIVOS $ 64.439.766 $ 65.951.766 $ 67.539.366<br />
GASTOS DE VENTAS $ 3.391.219 $ 3.798.347 $ 4.373.495<br />
UTILIDAD OPERACIONAL (utilidad bruta- G.F.) $ -3.233.956 $ 3.660.978 $ 13.936.524<br />
UTILIDAD ANTES DE IMPUESTOS (U.O. - Otr G.) $ -5.073.420 $ 2.594.311 $ 12.869.858<br />
IMPUESTOS $ 0 $ 856.123 $ 4.247.053<br />
UTILIDAD NETA $ -5.073.420 $ 1.738.188 $ 8.622.805<br />
Flujo <strong>de</strong> efectivo $ 549.441 $ 6.050.595 $ 15.547.648<br />
Inversiones $ 19.230.000 $ 350.000 $ 350.000<br />
Rendimiento sobre la inversión -41,97% 11,74% 31,91%<br />
Rendimiento sobre el patrimonio -52,81% 15,32% 43,18%<br />
Rentabilidad sobre los ingresos -3,89% 1,19% 5,13%<br />
Nivel <strong>de</strong> en<strong>de</strong>udamiento inicial 23,66%<br />
Punto <strong>de</strong> equilibrio anual $ 150.769.441<br />
Recuperación <strong>de</strong> la inversión EN EL AÑO 4<br />
TIR 5,43%<br />
VAN $ -3.954.275<br />
TASA DE INTERES DE OPORTUNIDAD 15,00%