info - Sección Limnología - Facultad de Ciencias
info - Sección Limnología - Facultad de Ciencias
info - Sección Limnología - Facultad de Ciencias

You also want an ePaper? Increase the reach of your titles
YUMPU automatically turns print PDFs into web optimized ePapers that Google loves.
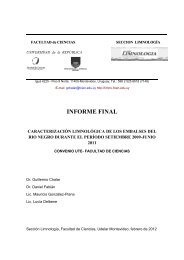
CONDUCTIVIDAD ELECTRICA (uS/cm<br />
TRANSPARENCIA DE SECCHI (cm<br />
pH<br />
8,5<br />
8,0<br />
7,5<br />
7,0<br />
6,5<br />
sep-<br />
09<br />
1000<br />
800<br />
600<br />
400<br />
200<br />
150<br />
120<br />
90<br />
60<br />
30<br />
0<br />
sep-<br />
09<br />
0<br />
sep-<br />
09<br />
oct-<br />
09<br />
oct-<br />
09<br />
oct-<br />
09<br />
1 2 3 4 5 6 7 8 9 10<br />
nov-<br />
09<br />
nov-<br />
09<br />
nov-<br />
09<br />
dic-<br />
09<br />
dic-<br />
09<br />
dic-<br />
09<br />
ene-<br />
10<br />
ene-<br />
10<br />
ene-<br />
10<br />
feb-<br />
10<br />
feb-<br />
10<br />
feb-<br />
10<br />
mar-<br />
10<br />
mar-<br />
10<br />
mar-<br />
10<br />
primero se <strong>de</strong>be a su origen en el arrastre por escorrentía superficial, mientras que lo<br />
segundo indica que son la causa principal <strong>de</strong> la turbi<strong>de</strong>z <strong>de</strong>l agua.<br />
La materia orgánica presenta un patrón similar aunque más variable cuando es<br />
expresada como porcentaje <strong>de</strong> los sólidos. En general se cumple que cuanto menos son<br />
los sólidos, mayor es su contenido porcentual <strong>de</strong> materia orgánica y viceversa, ya que el<br />
arrastre <strong>de</strong> partículas <strong>de</strong> suelo por erosión <strong>de</strong>l agua actúa fundamentalmente sobre<br />
partículas inorgánicas. Los SST y la MOS registraron el mismo comportamiento, con<br />
abr-<br />
10<br />
abr-<br />
10<br />
abr-<br />
10<br />
may-<br />
10<br />
may-<br />
10<br />
may-<br />
10<br />
jun-<br />
10<br />
jun-<br />
10<br />
jun-<br />
10<br />
jul-<br />
10<br />
jul-<br />
10<br />
jul-<br />
10<br />
ago-<br />
10<br />
ago-<br />
10<br />
ago-<br />
10<br />
sep-<br />
10<br />
sep-<br />
10<br />
Figura 6. Evolución <strong>de</strong>l pH (arriba), la conductividad eléctrica (centro) y transparencia <strong>de</strong>l disco<br />
<strong>de</strong> Secchi <strong>de</strong>l agua en los 10 arroyos a lo largo <strong>de</strong> los muestreos.<br />
sep-<br />
10<br />
17