Estudio de factibilidad.pdf
Estudio de factibilidad.pdf
Estudio de factibilidad.pdf
- No tags were found...

You also want an ePaper? Increase the reach of your titles
YUMPU automatically turns print PDFs into web optimized ePapers that Google loves.
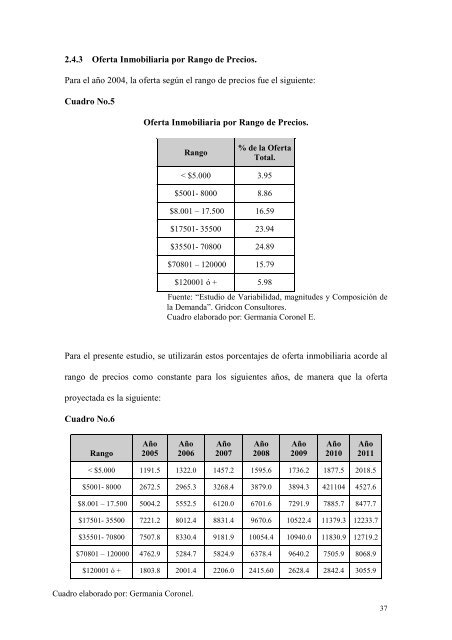
2.4.3 Oferta Inmobiliaria por Rango <strong>de</strong> Precios.Para el año 2004, la oferta según el rango <strong>de</strong> precios fue el siguiente:Cuadro No.5Oferta Inmobiliaria por Rango <strong>de</strong> Precios.Rango% <strong>de</strong> la OfertaTotal.< $5.000 3.95$5001- 8000 8.86$8.001 – 17.500 16.59$17501- 35500 23.94$35501- 70800 24.89$70801 – 120000 15.79$120001 ó + 5.98Fuente: “<strong>Estudio</strong> <strong>de</strong> Variabilidad, magnitu<strong>de</strong>s y Composición <strong>de</strong>la Demanda”. Gridcon Consultores.Cuadro elaborado por: Germania Coronel E.Para el presente estudio, se utilizarán estos porcentajes <strong>de</strong> oferta inmobiliaria acor<strong>de</strong> alrango <strong>de</strong> precios como constante para los siguientes años, <strong>de</strong> manera que la ofertaproyectada es la siguiente:Cuadro No.6RangoAño2005Año2006Año2007Año2008Año2009Año2010Año2011< $5.000 1191.5 1322.0 1457.2 1595.6 1736.2 1877.5 2018.5$5001- 8000 2672.5 2965.3 3268.4 3879.0 3894.3 421104 4527.6$8.001 – 17.500 5004.2 5552.5 6120.0 6701.6 7291.9 7885.7 8477.7$17501- 35500 7221.2 8012.4 8831.4 9670.6 10522.4 11379.3 12233.7$35501- 70800 7507.8 8330.4 9181.9 10054.4 10940.0 11830.9 12719.2$70801 – 120000 4762.9 5284.7 5824.9 6378.4 9640.2 7505.9 8068.9$120001 ó + 1803.8 2001.4 2206.0 2415.60 2628.4 2842.4 3055.9Cuadro elaborado por: Germania Coronel.37