Pensiones no contributivas para reducir la pobreza en el Perú
Pensiones no contributivas para reducir la pobreza en el Perú
Pensiones no contributivas para reducir la pobreza en el Perú

You also want an ePaper? Increase the reach of your titles
YUMPU automatically turns print PDFs into web optimized ePapers that Google loves.
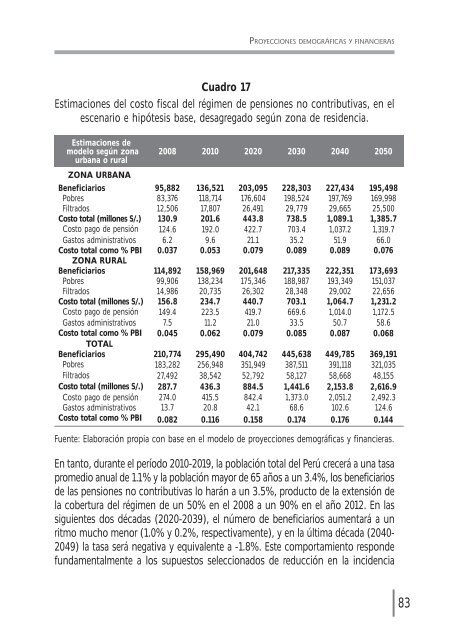
PROYECCIONES DEMOGRÁFICAS Y FINANCIERASCuadro 17Estimaciones d<strong>el</strong> costo fiscal d<strong>el</strong> régim<strong>en</strong> de p<strong>en</strong>siones <strong>no</strong> <strong>contributivas</strong>, <strong>en</strong> <strong>el</strong>esc<strong>en</strong>ario e hipótesis base, desagregado según zona de resid<strong>en</strong>cia.Estimaciones demod<strong>el</strong>o según zonaurbana o rural2008 2010 2020 2030 2040 2050ZONA URBANAB<strong>en</strong>eficiarios 95,882 136,521 203,095 228,303 227,434 195,498Pobres 83,376 118,714 176,604 198,524 197,769 169,998Filtrados 12,506 17,807 26,491 29,779 29,665 25,500Costo total (millones S/.) 130.9 201.6 443.8 738.5 1,089.1 1,385.7Costo pago de p<strong>en</strong>sión 124.6 192.0 422.7 703.4 1,037.2 1,319.7Gastos administrativos 6.2 9.6 21.1 35.2 51.9 66.0Costo total como % PBI 0.037 0.053 0.079 0.089 0.089 0.076ZONA RURALB<strong>en</strong>eficiarios 114,892 158,969 201,648 217,335 222,351 173,693Pobres 99,906 138,234 175,346 188,987 193,349 151,037Filtrados 14,986 20,735 26,302 28,348 29,002 22,656Costo total (millones S/.) 156.8 234.7 440.7 703.1 1,064.7 1,231.2Costo pago de p<strong>en</strong>sión 149.4 223.5 419.7 669.6 1,014.0 1,172.5Gastos administrativos 7.5 11.2 21.0 33.5 50.7 58.6Costo total como % PBI 0.045 0.062 0.079 0.085 0.087 0.068TOTALB<strong>en</strong>eficiarios 210,774 295,490 404,742 445,638 449,785 369,191Pobres 183,282 256,948 351,949 387,511 391,118 321,035Filtrados 27,492 38,542 52,792 58,127 58,668 48,155Costo total (millones S/.) 287.7 436.3 884.5 1,441.6 2,153.8 2,616.9Costo pago de p<strong>en</strong>sión 274.0 415.5 842.4 1,373.0 2,051.2 2,492.3Gastos administrativos 13.7 20.8 42.1 68.6 102.6 124.6Costo total como % PBI 0.082 0.116 0.158 0.174 0.176 0.144Fu<strong>en</strong>te: E<strong>la</strong>boración propia con base <strong>en</strong> <strong>el</strong> mod<strong>el</strong>o de proyecciones demográficas y financieras.En tanto, durante <strong>el</strong> período 2010-2019, <strong>la</strong> pob<strong>la</strong>ción total d<strong>el</strong> Perú crecerá a una tasapromedio anual de 1.1% y <strong>la</strong> pob<strong>la</strong>ción mayor de 65 años a un 3.4%, los b<strong>en</strong>eficiariosde <strong>la</strong>s p<strong>en</strong>siones <strong>no</strong> <strong>contributivas</strong> lo harán a un 3.5%, producto de <strong>la</strong> ext<strong>en</strong>sión de<strong>la</strong> cobertura d<strong>el</strong> régim<strong>en</strong> de un 50% <strong>en</strong> <strong>el</strong> 2008 a un 90% <strong>en</strong> <strong>el</strong> año 2012. En <strong>la</strong>ssigui<strong>en</strong>tes dos décadas (2020-2039), <strong>el</strong> número de b<strong>en</strong>eficiarios aum<strong>en</strong>tará a unritmo mucho me<strong>no</strong>r (1.0% y 0.2%, respectivam<strong>en</strong>te), y <strong>en</strong> <strong>la</strong> última década (2040-2049) <strong>la</strong> tasa será negativa y equival<strong>en</strong>te a -1.8%. Este comportami<strong>en</strong>to respondefundam<strong>en</strong>talm<strong>en</strong>te a los supuestos s<strong>el</strong>eccionados de reducción <strong>en</strong> <strong>la</strong> incid<strong>en</strong>cia83