Tableau 15.6.1 Opinion <strong>de</strong>s femmes concernant le refus d'avoir <strong>de</strong>s rapports sexuels avec leur mari/partenairePourcentage <strong>de</strong> toutes les femmes <strong>de</strong> 15-49 ans qui pensent qu'il est justifié que, dans certaines circonstances, une femmerefuse d'avoir <strong>de</strong>s rapports sexuels avec son mari/partenaire, selon certaines caractéristiques sociodémographiques, EDSMD-IV Madagascar 2008-2009CaractéristiquesociodémographiqueIl est justifié pour une femme <strong>de</strong> refuserd'avoir <strong>de</strong>s rapports sexuels avec sonmari quand elle:Sait que sonmari a unema<strong>la</strong>diesexuellementtransmissibleSait que sonmari a <strong>de</strong>srapportssexuels avecune autrefemmeEst fatiguéeou pasd'humeurPourcentage<strong>de</strong> femmes quisont d'accordavec toutesles raisonsavancéesPourcentage<strong>de</strong> femmes quine sontd'accord avecaucune <strong>de</strong>sraisonsavancéesEffectif <strong>de</strong>femmesGroupe d’âges15-19 90.6 87.9 88.1 80.8 4.7 1,96520-24 90.9 88.3 91.1 81.9 3.6 1,40525-29 91.5 90.0 92.1 83.6 3.1 1,36830-34 91.9 89.1 91.1 83.6 3.6 1,19935-39 92.4 92.0 92.1 85.1 2.3 99040-44 93.8 89.3 90.7 83.5 2.9 89445-49 92.4 89.1 90.0 82.1 3.3 725Emploi (12 <strong>de</strong>rniers mois)N'a pas travaillé 93.8 92.4 92.7 86.4 2.1 1,311A travaillé pour <strong>de</strong> l'argent 93.1 91.3 92.5 85.4 2.7 4,384A travaillé mais pas pour <strong>de</strong>l'argent 88.5 84.5 86.7 76.9 5.3 2,836État matrimonialCélibataire 91.6 89.7 88.6 82.4 4.2 1,566En union 91.7 89.0 91.2 82.7 3.2 5,899En rupture d’union 91.7 89.2 90.0 83.4 4.2 1,081Nombre d'enfants vivants0 92.0 89.5 89.2 82.6 3.8 2,1901-2 91.2 88.8 91.5 83.0 3.7 2,6723-4 92.1 89.2 90.8 82.6 2.9 1,9615+ 91.4 89.4 90.5 82.6 3.5 1,723Milieu <strong>de</strong> rési<strong>de</strong>nceCapitale 94.2 92.6 91.0 86.2 2.9 540Autres Villes 93.8 93.3 94.0 87.1 1.5 942Ensemble Urbain 94.0 93.0 92.9 86.8 2.0 1,483Rural 91.2 88.4 90.0 81.8 3.8 7,064RégionAna<strong>la</strong>manga 94.5 93.2 92.5 86.4 2.1 1,489Vakinankaratra 89.2 84.9 87.7 82.3 7.3 744Itasy 93.7 93.6 92.2 84.9 0.9 358Bongo<strong>la</strong>va 91.5 80.7 82.9 70.9 2.7 237Haute Matsiatra 89.8 80.8 86.5 75.1 4.8 451Amoron'i Mania 83.9 85.9 85.1 72.9 5.6 279Vatovavy Fitovinany 84.2 82.7 90.1 71.8 4.2 427Ihorombe 97.5 94.3 96.0 91.8 0.3 162Atsimo Atsinanana 76.0 71.8 70.7 57.1 13.9 277Atsinanana 91.7 91.1 92.6 85.5 3.0 542Ana<strong>la</strong>njirofo 88.4 85.4 87.0 80.0 6.4 413A<strong>la</strong>otra Mangoro 94.4 94.5 95.6 91.0 2.2 441Boeny 95.3 93.4 93.7 87.4 1.0 296Sofia 95.8 96.5 95.6 91.5 1.0 510Betsiboka 91.0 91.6 91.0 83.3 3.3 119Me<strong>la</strong>ky 86.6 79.5 84.8 75.1 9.4 91Atsimo Andrefana 95.8 97.8 96.9 93.5 0.9 441Androy 96.9 91.6 95.3 88.2 0.8 201Anosy 88.4 86.3 89.8 77.2 4.3 258Menabe 91.5 87.0 91.9 79.2 2.4 209Diana 96.8 91.4 94.7 87.5 1.2 227Sava 93.7 87.3 87.6 80.3 3.8 375Niveau d'instructionSans instruction 88.4 84.6 86.5 76.9 5.8 1,601Primaire/Alphabét. 90.5 87.8 89.4 80.8 4.0 4,246Secondaire ou plus 95.3 94.2 94.7 89.1 1.5 2,700Quintile <strong>de</strong> bien-êtreéconomiqueLe plus pauvre 88.0 85.3 87.3 77.7 5.4 1,521Second 89.3 86.5 88.5 79.6 4.9 1,599Moyen 90.9 86.5 88.7 80.0 4.2 1,576Quatrième 94.4 91.3 92.3 86.2 2.6 1,743Le plus riche 94.4 94.3 94.3 87.8 1.3 2,109Ensemble 1 91.6 89.2 90.5 82.7 3.5 8,5471Y compris 15 cas pour lesquels l’information sur l’emploi est non déterminée.Statut <strong>de</strong> <strong>la</strong> femme | 277
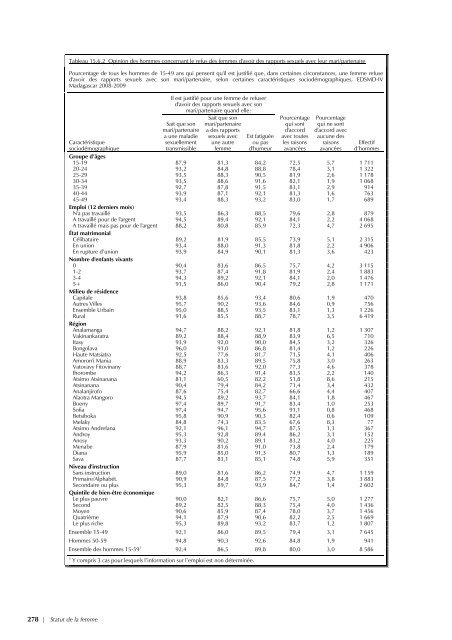
Tableau 15.6.2 Opinion <strong>de</strong>s hommes concernant le refus <strong>de</strong>s femmes d'avoir <strong>de</strong>s rapports sexuels avec leur mari/partenairePourcentage <strong>de</strong> tous les hommes <strong>de</strong> 15-49 ans qui pensent qu'il est justifié que, dans certaines circonstances, une femme refused'avoir <strong>de</strong>s rapports sexuels avec son mari/partenaire, selon certaines caractéristiques sociodémographiques, EDSMD-IVMadagascar 2008-2009CaractéristiquesociodémographiqueIl est justifié pour une femme <strong>de</strong> refuserd'avoir <strong>de</strong>s rapports sexuels avec sonmari/partenaire quand elle:Sait que sonmari/partenairea une ma<strong>la</strong>diesexuellementtransmissibleSait que sonmari/partenairea <strong>de</strong>s rapportssexuels avecune autrefemmeEst fatiguéeou pasd'humeurPourcentagequi sontd'accordavec toutesles raisonsavancéesPourcentagequi ne sontd'accord avecaucune <strong>de</strong>sraisonsavancéesEffectifd’hommesGroupe d’âges15-19 87,9 81,3 84,2 72,5 5,7 1 71120-24 93,2 84,8 88,8 78,4 3,1 1 32225-29 93,5 88,3 90,5 81,9 2,6 1 17830-34 93,5 88,6 91,6 82,1 1,9 1 06835-39 92,7 87,8 91,5 83,1 2,9 91440-44 93,9 87,1 92,1 81,3 1,6 76345-49 93,4 88,3 93,2 83,0 1,7 689Emploi (12 <strong>de</strong>rniers mois)N'a pas travaillé 93,5 86,3 88,5 79,6 2,8 879A travaillé pour <strong>de</strong> l'argent 94,5 89,4 92,1 84,1 2,2 4 068A travaillé mais pas pour <strong>de</strong> l'argent 88,2 80,8 85,9 72,3 4,7 2 695État matrimonialCélibataire 89,2 81,9 85,5 73,9 5,1 2 315En union 93,4 88,0 91,3 81,8 2,2 4 906En rupture d’union 93,9 84,9 90,1 81,3 3,6 423Nombre d'enfants vivants0 90,4 83,6 86,5 75,7 4,2 3 1151-2 93,7 87,4 91,8 81,9 2,4 1 8833-4 94,3 89,2 92,1 84,1 2,0 1 4765+ 91,5 86,0 90,4 79,2 2,8 1 171Milieu <strong>de</strong> rési<strong>de</strong>nceCapitale 93,8 85,6 93,4 80,6 1,9 470Autres Villes 95,7 90,2 93,6 84,6 0,9 756Ensemble Urbain 95,0 88,5 93,5 83,1 1,3 1 226Rural 91,6 85,5 88,7 78,7 3,5 6 419RégionAna<strong>la</strong>manga 94,7 88,2 92,1 81,8 1,2 1 307Vakinankaratra 89,2 88,4 88,9 83,9 6,5 710Itasy 93,9 92,0 90,0 84,5 3,2 326Bongo<strong>la</strong>va 96,0 91,0 86,8 81,4 1,2 226Haute Matsiatra 92,5 77,6 81,7 71,5 4,1 406Amoron'i Mania 88,9 83,3 89,5 75,8 3,0 263Vatovavy Fitovinany 88,7 83,6 92,0 77,3 4,6 378Ihorombe 94,2 86,3 91,4 83,5 2,2 140Atsimo Atsinanana 81,1 60,5 82,2 51,8 8,6 215Atsinanana 90,4 79,4 84,2 71,4 3,4 432Ana<strong>la</strong>njirofo 87,6 75,4 82,7 66,6 4,4 407A<strong>la</strong>otra Mangoro 94,5 89,2 93,7 84,1 1,8 467Boeny 97,4 89,7 91,7 83,4 1,0 253Sofia 97,4 94,7 95,6 91,1 0,8 468Betsiboka 95,8 90,9 90,3 82,4 0,6 109Me<strong>la</strong>ky 84,8 74,3 83,5 67,6 8,3 77Atsimo Andrefana 92,1 96,1 94,7 87,5 1,3 367Androy 95,3 92,8 89,4 86,2 3,1 152Anosy 93,3 90,2 89,1 83,2 4,0 225Menabe 87,9 81,6 91,0 73,8 2,4 179Diana 95,9 85,0 91,3 80,7 1,3 189Sava 87,7 83,1 85,1 74,8 5,9 351Niveau d'instructionSans instruction 89,0 81,6 86,2 74,9 4,7 1 159Primaire/Alphabét. 90,9 84,8 87,5 77,2 3,8 3 883Secondaire ou plus 95,3 89,7 93,9 84,7 1,4 2 602Quintile <strong>de</strong> bien-être économiqueLe plus pauvre 90,0 82,1 86,6 75,7 5,0 1 277Second 89,2 82,5 88,3 75,4 4,0 1 436Moyen 90,6 85,9 87,4 78,0 3,7 1 456Quatrième 94,1 87,9 90,6 82,2 2,5 1 669Le plus riche 95,3 89,8 93,2 83,7 1,2 1 807Ensemble 15-49 92,1 86,0 89,5 79,4 3,1 7 645Hommes 50-59 94,8 90,3 92,6 84,8 1,9 941Ensemble <strong>de</strong>s hommes 15-59 1 92,4 86,5 89,8 80,0 3,0 8 5861Y compris 3 cas pour lesquels l’information sur l’emploi est non déterminée.278 | Statut <strong>de</strong> <strong>la</strong> femme
- Page 1 and 2:
MadagascarEnquête Démographiqueet
- Page 4 and 5:
TABLE DES MATIÈRESPageLISTE DES TA
- Page 6 and 7:
CHAPITRE 8SANTÉ DE LA REPRODUCTION
- Page 8 and 9:
LISTE DES TABLEAUX ET DES GRAPHIQUE
- Page 10 and 11:
Tableau 5.17Connaissance par le mar
- Page 12 and 13:
CHAPITRE 11ALLAITEMENT ET NUTRITION
- Page 14 and 15:
Tableau 15.5.1 Opinion concernant l
- Page 16:
PRÉFACEMadagascar a mené sa quatr
- Page 20 and 21:
SIGLES ET ABRÉVIATIONSB.C.G.CAIDCB
- Page 22 and 23:
RÉSUMÉL’Enquête Démographique
- Page 24 and 25:
contraceptive moderne puisque le ta
- Page 26 and 27:
En ce qui concerne les enfants, on
- Page 29 and 30:
RÉPUBLIQUE DE MADAGASCARDiana±Can
- Page 31 and 32:
sud sont caractérisées par une ar
- Page 33 and 34:
du Gouvernement. Les actions visant
- Page 35 and 36:
• VIH/Sida et autres maladies sex
- Page 37 and 38:
L’enquête pilote a été effectu
- Page 39 and 40:
• Le sérum obtenu était ensuite
- Page 41 and 42:
Tableau 2.1 Eau de boisson utilisé
- Page 43 and 44:
Tableau 2.3 Caractéristiques des l
- Page 45 and 46:
Le tableau 2.5 présente la répart
- Page 47 and 48:
Tableau 2.6 Population des ménages
- Page 49 and 50:
Tableau 2.7 Composition des ménage
- Page 51 and 52:
Tableau 2.8⎯SuiteCaractéristique
- Page 53 and 54:
Tableau 2.10 Enregistrement des enf
- Page 55 and 56:
Tableau 2.11.2 Niveau d'instruction
- Page 57 and 58:
Le tableau 2.12 présente deux indi
- Page 59 and 60:
On ne note pratiquement pas d’éc
- Page 61 and 62:
Aux ménages qui avaient déclaré
- Page 63 and 64:
Le tableau 3.2 présente certaines
- Page 65 and 66:
Tableau 3.3 CirconcisionPourcentage
- Page 67 and 68:
Tableau 3.4.2 Niveau d'instruction
- Page 69 and 70:
Tableau 3.5.1 Alphabétisation : Fe
- Page 71 and 72:
Graphique 3.1 Proportions de femmes
- Page 73 and 74:
Tableau 3.6.2 Exposition aux média
- Page 75 and 76:
Tableau 3.7.1 Emploi : FemmesRépar
- Page 77 and 78:
Tableau 3.8.1 Occupation : FemmesR
- Page 79 and 80:
Globalement, la plus grande partie
- Page 81 and 82:
Tableau 3.10 Couverture médicaleR
- Page 83 and 84:
Tableau 3.11.2 Connaissance et atti
- Page 85 and 86:
Tableau 3.12.1 Consommation de taba
- Page 87 and 88:
On peut constater au tableau 3.12.1
- Page 89 and 90:
l’année 2003 sur l’année 2004
- Page 91 and 92:
nombre d’enfants par femme diminu
- Page 93 and 94:
• un maximum du niveau de la féc
- Page 95 and 96:
Graphique 4.4 Tendance de l'ISF pou
- Page 97 and 98:
Tableau 4.6 Intervalle intergénés
- Page 99 and 100:
4.5 ÂGE À LA PREMIÈRE NAISSANCED
- Page 101 and 102:
Tableau 4.9 Grossesse et fécondit
- Page 104 and 105:
PLANIFICATION FAMILIALE 5Jocelyn Yv
- Page 106 and 107:
milieu de résidence ne font appara
- Page 108 and 109:
Tableau 5.3 Utilisation de la contr
- Page 110 and 111:
La prévalence contraceptive est pl
- Page 112 and 113:
Tableau 5.5 Utilisation actuelle de
- Page 114 and 115:
Tableau 5.6 Nombre d'enfants à la
- Page 116 and 117:
dans le secteur public (80 %), dans
- Page 118 and 119:
ont reçu des informations fournies
- Page 120 and 121:
Pour évaluer la demande potentiell
- Page 122 and 123:
Au cours de l’enquête, on a coll
- Page 124:
Tableau 5.17 Connaissance par le ma
- Page 127 and 128:
La proportion de célibataires chez
- Page 129 and 130:
Tableau 6.2 Âge à la première un
- Page 131 and 132:
Tableau 6.3 Âge médian à la prem
- Page 133 and 134:
Graphique 6.4 Âge médian des femm
- Page 135 and 136:
Les résultats selon la région met
- Page 137 and 138:
Tableau 6.6.2 Activité sexuelle r
- Page 139 and 140:
pratiquement pas soumise au risque
- Page 141 and 142:
Tableau 6.8 Durée médiane de l'am
- Page 144 and 145:
PRÉFÉRENCES EN MATIÈRE DE FÉCON
- Page 146 and 147:
Graphique 7.1 Désir d'enfants supp
- Page 148 and 149:
7.2 BESOINS EN MATIÈRE DE PLANIFIC
- Page 150 and 151:
On constate par ailleurs que la dem
- Page 152 and 153:
D’une façon générale, on note
- Page 154:
femmes âgées de 40-44 ans ne s’
- Page 157 and 158:
Tableau 8.1 Soins prénatalsRépart
- Page 159 and 160:
Tableau 8.3 Composants des visites
- Page 161 and 162:
Tableau 8.4 Vaccination antitétani
- Page 163 and 164:
Tableau 8.5 Lieu de l'accouchementR
- Page 165 and 166:
Tableau 8.6—SuiteCaractéristique
- Page 167 and 168:
Tableau 8.7 Soins postnatalsRépart
- Page 169 and 170:
8.1.4 Accès Aux Soins de SantéDan
- Page 172 and 173:
SANTÉ DE L’ENFANT 9Jean Christia
- Page 174 and 175:
Tableau 9.1—SuiteCaractéristique
- Page 176 and 177:
eçu cette vaccination avant l’â
- Page 178 and 179:
Tableau 9.3 Vaccinations selon les
- Page 180 and 181:
Dans les régions, le niveau de la
- Page 182 and 183:
Tableau 9.5 Prévalence et traiteme
- Page 184 and 185:
Tableau 9.6 Prévalence et traiteme
- Page 186 and 187:
Tableau 9.7 Prévalence de la diarr
- Page 188 and 189:
Tableau 9.8 Connaissance des sachet
- Page 190 and 191:
Tableau 9.9 —SuiteCaractéristiqu
- Page 192 and 193:
Tableau 9.10 Pratiques alimentaires
- Page 194 and 195:
PALUDISME 10Mahery Alexandre Randri
- Page 196 and 197:
Tableau 10.1 Possession de moustiqu
- Page 198 and 199:
Tableau 10.2 Utilisation des mousti
- Page 200 and 201:
Tableau 10.3.1 Utilisation des mous
- Page 202 and 203:
Par rapport à la précédente enqu
- Page 204 and 205:
Au niveau national, les proportions
- Page 206 and 207:
Tableau 10.6 Recours à des antipal
- Page 208 and 209:
ALLAITEMENT ET NUTRITION 11Simon Ch
- Page 210 and 211:
Introduction de l’alimentation de
- Page 212 and 213:
Tableau 11.3 Durée médiane et fr
- Page 214 and 215:
Tableau 11.4 Aliments et liquides r
- Page 216 and 217:
Tableau 11.5—SuiteCaractéristiqu
- Page 218 and 219:
Tableau 11.6 Sel iodé dans le mén
- Page 220 and 221:
Tableau 11.7 Consommation de micron
- Page 222 and 223:
Tableau 11.8 Consommation de micron
- Page 224 and 225:
Le premier indicateur présenté au
- Page 226 and 227:
Tableau 11.9 Prévalence de l'aném
- Page 228 and 229:
Tableau 11.10 Prévalence de l'ané
- Page 230 and 231:
Tableau 11.11 Prévalence de l'ané
- Page 232 and 233:
Tableau 11.12 État nutritionnel de
- Page 234 and 235:
Graphique 11.3 Retard de croissance
- Page 236 and 237:
est calculé en divisant le poids (
- Page 238 and 239:
MORTALITÉ DES ENFANTS DE MOINS DE
- Page 240 and 241:
déplacements d'années de naissanc
- Page 242 and 243:
estimés de façon aussi importante
- Page 244 and 245:
Tableau 12.2 Quotients de mortalit
- Page 246 and 247:
Tableau 12.3 Quotients de mortalit
- Page 248:
Tableau 12.4 Comportement procréat
- Page 251 and 252:
• Est-ce que (NOM) est décédée
- Page 253 and 254:
Tableau 13.2 Indicateurs de la qual
- Page 255 and 256: Graphique 13.1 Taux de mortalité d
- Page 257 and 258: l’importance de l’intervalle de
- Page 259 and 260: permis de déterminer le niveau de
- Page 261 and 262: Tableau 14.2 Connaissance des moyen
- Page 263 and 264: Plus de six femmes sur dix (61 %) s
- Page 265 and 266: Connaissance de la prévention de l
- Page 267 and 268: Tableau 14.5.1 Attitudes de toléra
- Page 269 and 270: Tableau 14.5.2 Attitudes de toléra
- Page 271 and 272: élevée de femmes (95 %) que d’h
- Page 273 and 274: Tableau 14.8.1 Partenaires sexuels
- Page 275 and 276: Tableau 14.8.2 Partenaires sexuelle
- Page 277 and 278: Parmi les hommes de 15-49 ans, envi
- Page 279 and 280: Tableau 14.10.2 Population ayant ef
- Page 281 and 282: Tableau 14.11 Femmes enceintes, con
- Page 283 and 284: Tableau 14.12.1 Connaissance des si
- Page 285 and 286: Le tableau 14.13 présente les sign
- Page 287 and 288: minimum de 3 % à 40-49 ans, d’un
- Page 289 and 290: avec une seringue et une aiguille p
- Page 291 and 292: Les résultats du tableau 14.16 mon
- Page 293 and 294: Avec le report de l’âge aux prem
- Page 295 and 296: Tableau 14.19 Rapports sexuels pré
- Page 297 and 298: Tableau 14.20 Test du VIH récent p
- Page 299 and 300: Tableau 15.2 Contrôle du revenu de
- Page 301 and 302: Tableau 15.4 Participation des femm
- Page 303 and 304: Tableau 15.5.1 Opinion concernant l
- Page 305: Le tableau 15.5.2 présente les ré
- Page 310 and 311: PLAN DE SONDAGEANNEXE AA.1 INTRODUC
- Page 312 and 313: Un dénombrement des ménages dans
- Page 314 and 315: La probabilité globale pour tirer
- Page 316: Tableau A.5 Résultats de l'enquêt
- Page 319 and 320: où h représente la strate allant
- Page 321 and 322: Tableau B.2 Erreurs de sondage : Ec
- Page 323 and 324: Tableau B.4 Erreurs de sondage : É
- Page 325 and 326: Tableau B.6 Erreurs de sondage : É
- Page 327 and 328: Tableau B.9 Erreurs de sondage : É
- Page 329 and 330: Tableau B.13 Erreurs de sondage :
- Page 331 and 332: Tableau B.17 Erreurs de sondage :
- Page 333 and 334: Tableau B.21 Erreurs de sondage :
- Page 335 and 336: Tableau B.25 Erreurs de sondage :
- Page 338 and 339: TABLEAU POUR L’ÉVALUATION DE LAQ
- Page 340 and 341: Tableau C.3 Complétude de l’enre
- Page 342 and 343: Tableau C.6 Enregistrement de l'âg
- Page 344 and 345: Tableau C.7—SuiteTaille pour âge
- Page 346 and 347: PERSONNEL DE l’EDSMD-IVANNEXE DPE
- Page 348 and 349: Enquête principaleChefs d’équip
- Page 350: Rahary Mino Manoisoa OdineRajanaris
- Page 354 and 355: RÉPUBLIQUE DE MADAGASCARINSTITUT N
- Page 356 and 357:
TABLEAU DE MÉNAGENous voudrions, m
- Page 358 and 359:
SI 15 ANSOU PLUSSI ÂGÉ DE0-4 ANSR
- Page 360 and 361:
CARACTÉRISTIQUES DU MÉNAGEN O . Q
- Page 362 and 363:
N O . QUESTIONS ET FILTRES CODESALL
- Page 364 and 365:
N O . QUESTIONS ET FILTRES CODESALL
- Page 366 and 367:
MOUSTIQUAIRE #1 MOUSTIQUAIRE #2 MOU
- Page 368 and 369:
ENQUÊTE DÉMOGRAPHIQUE ET DE SANT
- Page 370 and 371:
ENFANT 4 ENFANT 5 ENFANT 6102 DANS
- Page 372 and 373:
ADULTE 1 ADULTE 2ADULTE 3 ADULTE 4N
- Page 374 and 375:
TEST DE SYPHILIS - INDENTIFICATION
- Page 376 and 377:
ADULTE 1 ADULTE 2 ADULTE 3ADULTE 43
- Page 378 and 379:
ADULTE 1 ADULTE 2 ADULTE 3 ADULTE 4
- Page 380 and 381:
ADULTE 1 ADULTE 2 ADULTE 3 ADULTE 4
- Page 382:
OBSERVATIONS DE L’INFIRMIÈREÀ R
- Page 385 and 386:
SECTION 1. CARACTÉRISTIQUES SOCIOD
- Page 387 and 388:
N o .QUESTIONS ET FILTRESSECTION 2.
- Page 389 and 390:
212213214215216217 218 219SI EN VIE
- Page 391 and 392:
N O .QUESTIONS ET FILTRESCATÉGORIE
- Page 393 and 394:
N OQUESTIONS ET FILTRESCODESPASSER
- Page 395 and 396:
N OQUESTIONS ET FILTRESCODESPASSER
- Page 397 and 398:
N OQUESTIONS ET FILTRESCODESPASSER
- Page 399 and 400:
DERNIÈRE NAISSANCEAVANT-DERNIÈRE
- Page 401 and 402:
DERNIÈRE NAISSANCEAVANT-DERNIÈRE
- Page 403 and 404:
DERNIÈRE NAISSANCEAVANT-DERNIÈRE
- Page 405 and 406:
DERNIÈRE NAISSANCEAVANT-DERNIÈRE
- Page 407 and 408:
DERNIÈRE NAISSANCEAVANT-DERNIÈRE
- Page 409 and 410:
DERNIÈRE NAISSANCEAVANT-DERNIÈRE
- Page 411 and 412:
DERNIÈRE NAISSANCEAVANT-DERNIÈRE
- Page 413 and 414:
DERNIÈRE NAISSANCEAVANT-DERNIÈRE
- Page 415 and 416:
DERNIÈRE NAISSANCEAVANT-DERNIÈRE
- Page 417 and 418:
DERNIÈRE NAISSANCEAVANT-DERNIÈRE
- Page 419 and 420:
N OQUESTIONS ET FILTRESCODESPASSER
- Page 421 and 422:
SECTION 6. MARIAGE ET ACTIVITÉ SEX
- Page 423 and 424:
DERNIERPARTENAIRE SEXUELAVANT-DERNI
- Page 425 and 426:
N o QUESTIONS ET FILTRES CODES PASS
- Page 427 and 428:
N OSECTION 7. PRÉFÉRENCES EN MATI
- Page 429 and 430:
N O QUESTIONS ET FILTRES CODES PASS
- Page 431 and 432:
SECTION 8. CARACTÉRISTIQUES DU CON
- Page 433 and 434:
N O QUESTIONS ET FILTRES CODES PASS
- Page 435 and 436:
N o QUESTIONS ET FILTRES CODES PASS
- Page 437 and 438:
N o QUESTIONS ET FILTRES CODES PASS
- Page 439 and 440:
N o QUESTIONS ET FILTRES CODES PASS
- Page 441 and 442:
N oQUESTIONS ET FILTRES CODESPASSER
- Page 443 and 444:
SECTION 11. MORTALITÉ MATERNELLENO
- Page 445 and 446:
1104 Quel nom a été[7] [8] [9] [1
- Page 447 and 448:
COMMENTAIRES CONCERNANT L'ENQUÊTÉ
- Page 449 and 450:
INTRODUCTION ET CONSENTEMENTSECTION
- Page 451 and 452:
SECTION 2. REPRODUCTIONN o .QUESTIO
- Page 453 and 454:
SECTION 3. CONTRACEPTION301 Je voud
- Page 455 and 456:
N o . QUESTIONS ET FILTRES CODES PA
- Page 457 and 458:
N o QUESTIONS ET FILTRESCODES PASSE
- Page 459 and 460:
DERNIERPARTENAIRE SEXUELAVANT-DERNI
- Page 461 and 462:
N O QUESTIONS ET FILTRES CODES PASS
- Page 463 and 464:
N O QUESTIONS ET FILTRES CODES PASS
- Page 465 and 466:
N o QUESTIONS ET FILTRES CODES PASS
- Page 467 and 468:
N o QUESTIONS ET FILTRES CODES PASS
- Page 469 and 470:
N o QUESTIONS ET FILTRES CODES PASS
- Page 471 and 472:
SECTION 8. AUTRES PROBLÈMES DE SAN
- Page 473:
COMMENTAIRES CONCERNANT L'ENQUÊTÉ