pdf 4 986 ko - Institut national de la statistique malgache (INSTAT)
pdf 4 986 ko - Institut national de la statistique malgache (INSTAT)
pdf 4 986 ko - Institut national de la statistique malgache (INSTAT)
- No tags were found...

You also want an ePaper? Increase the reach of your titles
YUMPU automatically turns print PDFs into web optimized ePapers that Google loves.
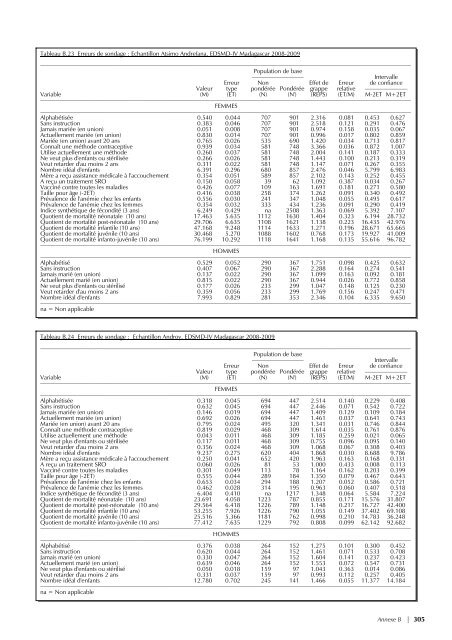
Tableau B.23 Erreurs <strong>de</strong> sondage : Échantillon Atsimo Andrefana, EDSMD-IV Madagascar 2008-2009––––––––––––––––––––––––––––––––––––––––––––––––––––––––––––––––––––––––––––––––––––––––––––––––––––––––––––––––––––––––––Popu<strong>la</strong>tion <strong>de</strong> base––––––––––––––––– IntervalleErreur Non Effet <strong>de</strong> Erreur <strong>de</strong> confianceValeur type pondérée Pondérée grappe re<strong>la</strong>tive ––––––––––––––Variable (M) (ET) (N) (N') (REPS) (ET/M) M-2ET M+2ET––––––––––––––––––––––––––––––––––––––––––––––––––––––––––––––––––––––––––––––––––––––––––––––––––––––––––––––––––––––––––FEMMES––––––––––––––––––––––––––––––––––––––––––––––––––––––––––––––––––––––––––––––––––––––––––––––––––––––––––––––––––––––––––Alphabétisée 0.540 0.044 707 901 2.316 0.081 0.453 0.627Sans instruction 0.383 0.046 707 901 2.518 0.121 0.291 0.476Jamais mariée (en union) 0.051 0.008 707 901 0.974 0.158 0.035 0.067Actuellement mariée (en union) 0.830 0.014 707 901 0.996 0.017 0.802 0.859Mariée (en union) avant 20 ans 0.765 0.026 535 690 1.420 0.034 0.713 0.817Connaît une métho<strong>de</strong> contraceptive 0.939 0.034 581 748 3.366 0.036 0.872 1.007Utilise actuellement une métho<strong>de</strong> 0.260 0.037 581 748 2.004 0.141 0.187 0.333Ne veut plus d'enfants ou stérilisée 0.266 0.026 581 748 1.443 0.100 0.213 0.319Veut retar<strong>de</strong>r d'au moins 2 ans 0.311 0.022 581 748 1.147 0.071 0.267 0.355Nombre idéal d'enfants 6.391 0.296 680 857 2.476 0.046 5.799 6.983Mère a reçu assistance médicale à l'accouchement 0.354 0.051 589 857 2.102 0.143 0.252 0.455A reçu un traitement SRO 0.150 0.058 39 62 1.092 0.387 0.034 0.267Vacciné contre toutes les ma<strong>la</strong>dies 0.426 0.077 109 163 1.691 0.181 0.271 0.580Taille pour âge (-2ET) 0.416 0.038 258 374 1.262 0.091 0.340 0.492Prévalence <strong>de</strong> l'anémie chez les enfants 0.556 0.030 241 347 1.048 0.055 0.495 0.617Prévalence <strong>de</strong> l'anémie chez les femmes 0.354 0.032 333 434 1.236 0.091 0.290 0.419Indice synthétique <strong>de</strong> fécondité (3 ans) 6.249 0.429 na 2508 1.363 0.069 5.392 7.107Quotient <strong>de</strong> mortalité néonatale (10 ans) 17.463 5.635 1112 1630 1.404 0.323 6.194 28.732Quotient <strong>de</strong> mortalité post-néonatale (10 ans) 29.706 6.635 1108 1621 1.138 0.223 16.435 42.976Quotient <strong>de</strong> mortalité infantile (10 ans) 47.168 9.248 1114 1633 1.271 0.196 28.671 65.665Quotient <strong>de</strong> mortalité juvénile (10 ans) 30.468 5.270 1088 1602 0.768 0.173 19.927 41.009Quotient <strong>de</strong> mortalité infanto-juvénile (10 ans) 76.199 10.292 1118 1641 1.168 0.135 55.616 96.782––––––––––––––––––––––––––––––––––––––––––––––––––––––––––––––––––––––––––––––––––––––––––––––––––––––––––––––––––––––––––HOMMES––––––––––––––––––––––––––––––––––––––––––––––––––––––––––––––––––––––––––––––––––––––––––––––––––––––––––––––––––––––––––Alphabétisé 0.529 0.052 290 367 1.751 0.098 0.425 0.632Sans instruction 0.407 0.067 290 367 2.288 0.164 0.274 0.541Jamais marié (en union) 0.137 0.022 290 367 1.099 0.163 0.092 0.181Actuellement marié (en union) 0.815 0.022 290 367 0.944 0.026 0.772 0.858Ne veut plus d'enfants ou stérilisé 0.177 0.026 233 299 1.047 0.148 0.125 0.230Veut retar<strong>de</strong>r d'au moins 2 ans 0.359 0.056 233 299 1.769 0.156 0.247 0.471Nombre idéal d'enfants 7.993 0.829 281 353 2.346 0.104 6.335 9.650––––––––––––––––––––––––––––––––––––––––––––––––––––––––––––––––––––––––––––––––––––––––––––––––––––––––––––––––––––––––––na = Non applicableTableau B.24 Erreurs <strong>de</strong> sondage : Échantillon Androy, EDSMD-IV Madagascar 2008-2009––––––––––––––––––––––––––––––––––––––––––––––––––––––––––––––––––––––––––––––––––––––––––––––––––––––––––––––––––––––––––Popu<strong>la</strong>tion <strong>de</strong> base––––––––––––––––– IntervalleErreur Non Effet <strong>de</strong> Erreur <strong>de</strong> confianceValeur type pondérée Pondérée grappe re<strong>la</strong>tive ––––––––––––––Variable (M) (ET) (N) (N') (REPS) (ET/M) M-2ET M+2ET––––––––––––––––––––––––––––––––––––––––––––––––––––––––––––––––––––––––––––––––––––––––––––––––––––––––––––––––––––––––––FEMMES––––––––––––––––––––––––––––––––––––––––––––––––––––––––––––––––––––––––––––––––––––––––––––––––––––––––––––––––––––––––––Alphabétisée 0.318 0.045 694 447 2.514 0.140 0.229 0.408Sans instruction 0.632 0.045 694 447 2.446 0.071 0.542 0.722Jamais mariée (en union) 0.146 0.019 694 447 1.409 0.129 0.109 0.184Actuellement mariée (en union) 0.692 0.026 694 447 1.461 0.037 0.641 0.743Mariée (en union) avant 20 ans 0.795 0.024 495 320 1.341 0.031 0.746 0.844Connaît une métho<strong>de</strong> contraceptive 0.819 0.029 468 309 1.614 0.035 0.761 0.876Utilise actuellement une métho<strong>de</strong> 0.043 0.011 468 309 1.185 0.259 0.021 0.065Ne veut plus d'enfants ou stérilisée 0.117 0.011 468 309 0.755 0.096 0.095 0.140Veut retar<strong>de</strong>r d'au moins 2 ans 0.356 0.024 468 309 1.068 0.067 0.308 0.403Nombre idéal d'enfants 9.237 0.275 620 404 1.868 0.030 8.688 9.786Mère a reçu assistance médicale à l'accouchement 0.250 0.041 652 420 1.963 0.163 0.168 0.331A reçu un traitement SRO 0.060 0.026 81 53 1.000 0.433 0.008 0.113Vacciné contre toutes les ma<strong>la</strong>dies 0.301 0.049 113 78 1.164 0.162 0.203 0.399Taille pour âge (-2ET) 0.555 0.044 289 184 1.350 0.079 0.467 0.643Prévalence <strong>de</strong> l'anémie chez les enfants 0.653 0.034 294 188 1.207 0.052 0.586 0.721Prévalence <strong>de</strong> l'anémie chez les femmes 0.462 0.028 314 195 0.963 0.060 0.407 0.518Indice synthétique <strong>de</strong> fécondité (3 ans) 6.404 0.410 na 1217 1.348 0.064 5.584 7.224Quotient <strong>de</strong> mortalité néonatale (10 ans) 23.691 4.058 1223 787 0.855 0.171 15.576 31.807Quotient <strong>de</strong> mortalité post-néonatale (10 ans) 29.564 6.418 1226 789 1.148 0.217 16.727 42.400Quotient <strong>de</strong> mortalité infantile (10 ans) 53.255 7.926 1226 790 1.055 0.149 37.402 69.108Quotient <strong>de</strong> mortalité juvénile (10 ans) 25.516 5.366 1181 762 0.998 0.210 14.783 36.248Quotient <strong>de</strong> mortalité infanto-juvénile (10 ans) 77.412 7.635 1229 792 0.808 0.099 62.142 92.682––––––––––––––––––––––––––––––––––––––––––––––––––––––––––––––––––––––––––––––––––––––––––––––––––––––––––––––––––––––––––HOMMES––––––––––––––––––––––––––––––––––––––––––––––––––––––––––––––––––––––––––––––––––––––––––––––––––––––––––––––––––––––––––Alphabétisé 0.376 0.038 264 152 1.275 0.101 0.300 0.452Sans instruction 0.620 0.044 264 152 1.461 0.071 0.533 0.708Jamais marié (en union) 0.330 0.047 264 152 1.604 0.141 0.237 0.423Actuellement marié (en union) 0.639 0.046 264 152 1.553 0.072 0.547 0.731Ne veut plus d'enfants ou stérilisé 0.050 0.018 159 97 1.043 0.363 0.014 0.086Veut retar<strong>de</strong>r d'au moins 2 ans 0.331 0.037 159 97 0.993 0.112 0.257 0.405Nombre idéal d'enfants 12.780 0.702 245 141 1.466 0.055 11.377 14.184––––––––––––––––––––––––––––––––––––––––––––––––––––––––––––––––––––––––––––––––––––––––––––––––––––––––––––––––––––––––––na = Non applicableAnnexe B | 305