pdf 4 986 ko - Institut national de la statistique malgache (INSTAT)
pdf 4 986 ko - Institut national de la statistique malgache (INSTAT)
pdf 4 986 ko - Institut national de la statistique malgache (INSTAT)
- No tags were found...

You also want an ePaper? Increase the reach of your titles
YUMPU automatically turns print PDFs into web optimized ePapers that Google loves.
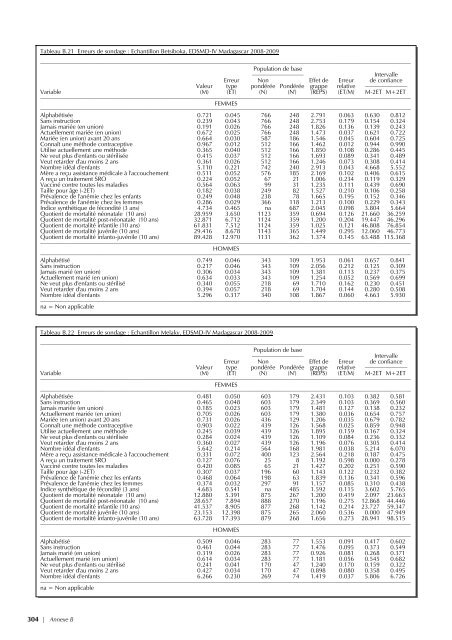
Tableau B.21 Erreurs <strong>de</strong> sondage : Échantillon Betsiboka, EDSMD-IV Madagascar 2008-2009––––––––––––––––––––––––––––––––––––––––––––––––––––––––––––––––––––––––––––––––––––––––––––––––––––––––––––––––––––––––––Popu<strong>la</strong>tion <strong>de</strong> base––––––––––––––––– IntervalleErreur Non Effet <strong>de</strong> Erreur <strong>de</strong> confianceValeur type pondérée Pondérée grappe re<strong>la</strong>tive ––––––––––––––Variable (M) (ET) (N) (N') (REPS) (ET/M) M-2ET M+2ET––––––––––––––––––––––––––––––––––––––––––––––––––––––––––––––––––––––––––––––––––––––––––––––––––––––––––––––––––––––––––FEMMES––––––––––––––––––––––––––––––––––––––––––––––––––––––––––––––––––––––––––––––––––––––––––––––––––––––––––––––––––––––––––Alphabétisée 0.721 0.045 766 248 2.791 0.063 0.630 0.812Sans instruction 0.239 0.043 766 248 2.753 0.179 0.154 0.324Jamais mariée (en union) 0.191 0.026 766 248 1.826 0.136 0.139 0.243Actuellement mariée (en union) 0.672 0.025 766 248 1.473 0.037 0.621 0.722Mariée (en union) avant 20 ans 0.664 0.030 587 186 1.546 0.045 0.604 0.725Connaît une métho<strong>de</strong> contraceptive 0.967 0.012 512 166 1.462 0.012 0.944 0.990Utilise actuellement une métho<strong>de</strong> 0.365 0.040 512 166 1.850 0.108 0.286 0.445Ne veut plus d'enfants ou stérilisée 0.415 0.037 512 166 1.693 0.089 0.341 0.489Veut retar<strong>de</strong>r d'au moins 2 ans 0.361 0.026 512 166 1.246 0.073 0.308 0.414Nombre idéal d'enfants 5.110 0.221 742 240 2.913 0.043 4.668 5.552Mère a reçu assistance médicale à l'accouchement 0.511 0.052 576 185 2.169 0.102 0.406 0.615A reçu un traitement SRO 0.224 0.052 67 21 1.006 0.234 0.119 0.329Vacciné contre toutes les ma<strong>la</strong>dies 0.564 0.063 99 31 1.235 0.111 0.439 0.690Taille pour âge (-2ET) 0.182 0.038 249 82 1.527 0.210 0.106 0.258Prévalence <strong>de</strong> l'anémie chez les enfants 0.249 0.048 238 78 1.665 0.195 0.152 0.346Prévalence <strong>de</strong> l'anémie chez les femmes 0.286 0.029 366 118 1.213 0.100 0.229 0.343Indice synthétique <strong>de</strong> fécondité (3 ans) 4.734 0.465 na 687 2.045 0.098 3.804 5.664Quotient <strong>de</strong> mortalité néonatale (10 ans) 28.959 3.650 1123 359 0.694 0.126 21.660 36.259Quotient <strong>de</strong> mortalité post-néonatale (10 ans) 32.871 6.712 1124 359 1.200 0.204 19.447 46.296Quotient <strong>de</strong> mortalité infantile (10 ans) 61.831 7.512 1124 359 1.025 0.121 46.808 76.854Quotient <strong>de</strong> mortalité juvénile (10 ans) 29.416 8.678 1143 365 1.449 0.295 12.060 46.773Quotient <strong>de</strong> mortalité infanto-juvénile (10 ans) 89.428 12.970 1131 362 1.374 0.145 63.488 115.368––––––––––––––––––––––––––––––––––––––––––––––––––––––––––––––––––––––––––––––––––––––––––––––––––––––––––––––––––––––––––HOMMES––––––––––––––––––––––––––––––––––––––––––––––––––––––––––––––––––––––––––––––––––––––––––––––––––––––––––––––––––––––––––Alphabétisé 0.749 0.046 343 109 1.953 0.061 0.657 0.841Sans instruction 0.217 0.046 343 109 2.056 0.212 0.125 0.309Jamais marié (en union) 0.306 0.034 343 109 1.381 0.113 0.237 0.375Actuellement marié (en union) 0.634 0.033 343 109 1.254 0.052 0.569 0.699Ne veut plus d'enfants ou stérilisé 0.340 0.055 218 69 1.710 0.162 0.230 0.451Veut retar<strong>de</strong>r d'au moins 2 ans 0.394 0.057 218 69 1.704 0.144 0.280 0.508Nombre idéal d'enfants 5.296 0.317 340 108 1.867 0.060 4.663 5.930––––––––––––––––––––––––––––––––––––––––––––––––––––––––––––––––––––––––––––––––––––––––––––––––––––––––––––––––––––––––––na = Non applicableTableau B.22 Erreurs <strong>de</strong> sondage : Échantillon Me<strong>la</strong>ky, EDSMD-IV Madagascar 2008-2009––––––––––––––––––––––––––––––––––––––––––––––––––––––––––––––––––––––––––––––––––––––––––––––––––––––––––––––––––––––––––Popu<strong>la</strong>tion <strong>de</strong> base––––––––––––––––– IntervalleErreur Non Effet <strong>de</strong> Erreur <strong>de</strong> confianceValeur type pondérée Pondérée grappe re<strong>la</strong>tive ––––––––––––––Variable (M) (ET) (N) (N') (REPS) (ET/M) M-2ET M+2ET––––––––––––––––––––––––––––––––––––––––––––––––––––––––––––––––––––––––––––––––––––––––––––––––––––––––––––––––––––––––––FEMMES––––––––––––––––––––––––––––––––––––––––––––––––––––––––––––––––––––––––––––––––––––––––––––––––––––––––––––––––––––––––––Alphabétisée 0.481 0.050 603 179 2.431 0.103 0.382 0.581Sans instruction 0.465 0.048 603 179 2.349 0.103 0.369 0.560Jamais mariée (en union) 0.185 0.023 603 179 1.481 0.127 0.138 0.232Actuellement mariée (en union) 0.705 0.026 603 179 1.380 0.036 0.654 0.757Mariée (en union) avant 20 ans 0.731 0.026 436 129 1.206 0.035 0.679 0.782Connaît une métho<strong>de</strong> contraceptive 0.903 0.022 439 126 1.568 0.025 0.859 0.948Utilise actuellement une métho<strong>de</strong> 0.245 0.039 439 126 1.895 0.159 0.167 0.324Ne veut plus d'enfants ou stérilisée 0.284 0.024 439 126 1.109 0.084 0.236 0.332Veut retar<strong>de</strong>r d'au moins 2 ans 0.360 0.027 439 126 1.196 0.076 0.305 0.414Nombre idéal d'enfants 5.642 0.214 564 168 1.981 0.038 5.214 6.070Mère a reçu assistance médicale à l'accouchement 0.331 0.072 400 123 2.564 0.218 0.187 0.475A reçu un traitement SRO 0.127 0.076 25 8 1.192 0.598 0.000 0.278Vacciné contre toutes les ma<strong>la</strong>dies 0.420 0.085 65 21 1.427 0.202 0.251 0.590Taille pour âge (-2ET) 0.307 0.037 196 60 1.143 0.122 0.232 0.382Prévalence <strong>de</strong> l'anémie chez les enfants 0.468 0.064 198 63 1.839 0.136 0.341 0.596Prévalence <strong>de</strong> l'anémie chez les femmes 0.374 0.032 297 91 1.157 0.085 0.310 0.438Indice synthétique <strong>de</strong> fécondité (3 ans) 4.683 0.541 na 485 1.592 0.115 3.602 5.765Quotient <strong>de</strong> mortalité néonatale (10 ans) 12.880 5.391 875 267 1.200 0.419 2.097 23.663Quotient <strong>de</strong> mortalité post-néonatale (10 ans) 28.657 7.894 888 270 1.196 0.275 12.868 44.446Quotient <strong>de</strong> mortalité infantile (10 ans) 41.537 8.905 877 268 1.142 0.214 23.727 59.347Quotient <strong>de</strong> mortalité juvénile (10 ans) 23.153 12.398 875 265 2.060 0.536 0.000 47.949Quotient <strong>de</strong> mortalité infanto-juvénile (10 ans) 63.728 17.393 879 268 1.656 0.273 28.941 98.515––––––––––––––––––––––––––––––––––––––––––––––––––––––––––––––––––––––––––––––––––––––––––––––––––––––––––––––––––––––––––HOMMES––––––––––––––––––––––––––––––––––––––––––––––––––––––––––––––––––––––––––––––––––––––––––––––––––––––––––––––––––––––––––Alphabétisé 0.509 0.046 283 77 1.553 0.091 0.417 0.602Sans instruction 0.461 0.044 283 77 1.476 0.095 0.373 0.549Jamais marié (en union) 0.319 0.026 283 77 0.926 0.081 0.268 0.371Actuellement marié (en union) 0.614 0.034 283 77 1.181 0.056 0.545 0.682Ne veut plus d'enfants ou stérilisé 0.241 0.041 170 47 1.240 0.170 0.159 0.322Veut retar<strong>de</strong>r d'au moins 2 ans 0.427 0.034 170 47 0.898 0.080 0.358 0.495Nombre idéal d'enfants 6.266 0.230 269 74 1.419 0.037 5.806 6.726––––––––––––––––––––––––––––––––––––––––––––––––––––––––––––––––––––––––––––––––––––––––––––––––––––––––––––––––––––––––––na = Non applicable304 | Annexe B